Reproduce analysis of a political attitudes experiment
14 November 2020
I reproduce the analysis of data from a recently published experiment on the impact on Australians' and New Zealanders' attitudes to overseas aid of being exposed to writing about Chinese aid in the Pacific. Along the way I muse about the Table 2 fallacy, and try to avoid it while still using multiple imputation, bootstrap and adjusting for covariates to slightly improve the original analysis.

Free text in surveys - important issues in the 2017 New Zealand Election Study
26 September 2020
I try out biterm topic modelling on a free text question in the 2017 New Zealand Election Study about the most important issue in the election.

Forecasts for the 2020 New Zealand elections using R and Stan
06 June 2020
My forecasts for the 2020 New Zealand general election are out, and predict a comfortable win for Jacinda Ardern's Labour Party either alone or in coalition.

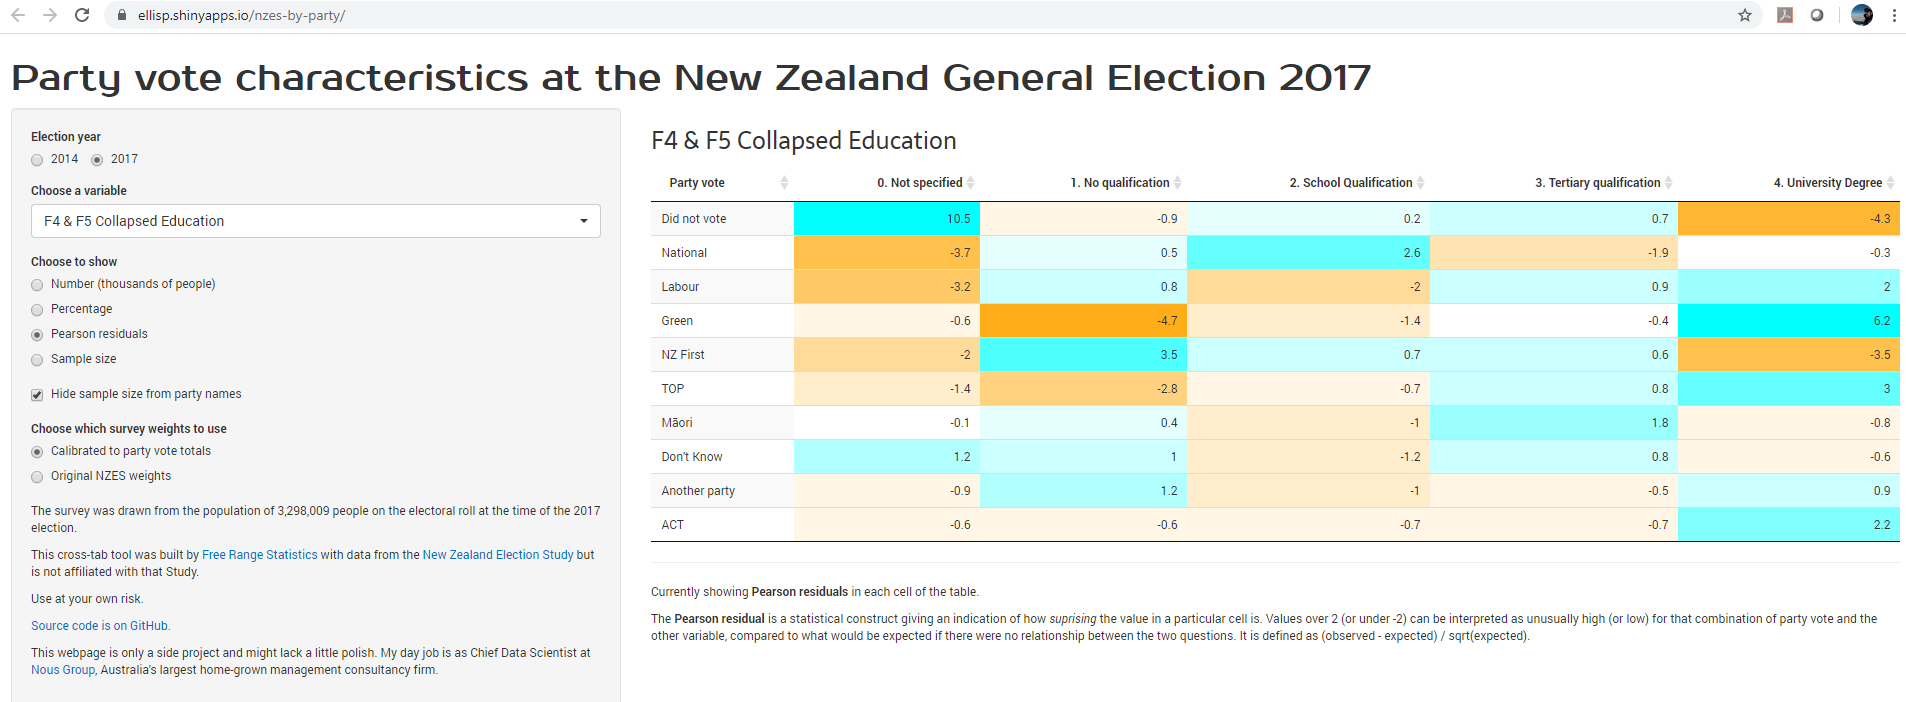
New Zealand Election Study webtool
07 March 2020
I release an improved and updated version of my crosstab webtool for exploring the New Zealand Election Study data, now covering 2017 as well as 2014, and letting the user explore relationship between party vote and a range of attitudes, experiences and demographics.
Re-creating survey microdata from marginal totals
03 November 2019
I play around with creating my own synthetic unit record file of survey microdata to match published marginal totals. I conclude that making synthetic data for development or education purposes can be useful, but the effort to try to exactly match marginal totals from this sort of survey is unlikely to be useful for either bona fide researchers or ill-intentioned data snoopers.

Seasonality in NZ voting preference?
20 February 2019
I update the nzelect R package with the latest New Zealand polling data, and use a generalized additive model to look for a seasonal impact on support for the current government.

Time series intervention analysis with fuel prices
14 August 2018
I look into whether the regional fuel tax in Auckland has led to changes in fuel prices in other regions of New Zealand.

Leading indicators of economic growth
10 August 2018
A demo of a favourite combination of multiple imputation, bootstrap and elastic net regularization. I look at what are good leading indicators, with reliable data available, of New Zealand's economic growth. The results turn out to be last quarter's economic growth; food prices; visitor arrivals; car registrations; business confidence; and electronic card transactions.

Business confidence and economic growth
01 August 2018
I have a brief look at the relationship between reported business confidence in New Zealand and what actually happens down the track with economic growth. Confidence can help (a bit) explain future growth; but current and past growth isn't helpful in explaining confidence.

Weighted survey data with Power BI compared to dplyr, SQL or survey
11 April 2018
I show a workaround to make it (relatively) easy to work with weighted survey data in Power BI, and ruminate on how this compares to other approaches of working with weighted data.

Visualising an ethnicity statistical classification
10 February 2018
An interactive network graph is a great way to understand a statistical classification standard.

Average spend, activities and length of visit in the NZ International Visitor Survey
03 February 2018
Resolving an apparent conundrum where the mean spend and other value variables seems to be higher for nearly everywhere... an adventure in double counting (individuals contributing to multiple groups' averages).

How to recruit data analysts for the public sector
23 January 2018
Reflections on recruiting data scientists for the public sector, which could maybe be used as practical guidance for someone.

New Zealand fatal traffic crashes
15 October 2017
I explore half a million rows of disaggregated crash data for New Zealand, and along the way illustrate geo-spatial projections, maps, forecasting with ensembles of methods, a state space model for change over time, and a generalized linear model for understanding interactions in a three-way cross tab.

New Zealand 2017 election results
07 October 2017
New Zealand's election results have been released and were within the range of my probabilistic predictions. The pollsters did a good job.

nzelect 0.4.0 on CRAN with results from 2002 to 2014 and polls up to September 2017
05 October 2017
A new version of the nzelect R package is on CRAN, with election results by voting location back to 2002, and polls up to the latest election. I show how to extract and understand the "special" votes and how they are different to advance voting.

Time-varying house effects in New Zealand political polls
16 September 2017
I adjust my state-space model of New Zealand voting behaviour to allow for the house effect of one of the pollsters to change from the time they started including an on-line sample, and get some interesting results.

R Markdown for documents with logos, watermarks, and corporate styles
09 September 2017
I outline how I structure analytical project folder systems and some hints for matching R Markdown documents to a corporate style guide including adding logos, watermarks, and of course colours and fonts.

The long view on New Zealand political polls
09 September 2017
New Zealand electoral polls going back 15 years

More things with the New Zealand Election Study
20 August 2017
I introduce a new web app that allows nons-specialists to explore voting behaviour in the New Zealand Election Study, and reflect on what I've done so far with that data.
Family violence and economic deprivation in New Zealand
02 July 2017
I look at the interaction between deprivation, being Māori, and family violence - combining data from the New Zealand census, the New Zealand index of deprivation, and the Family Violence Death Review Committee.

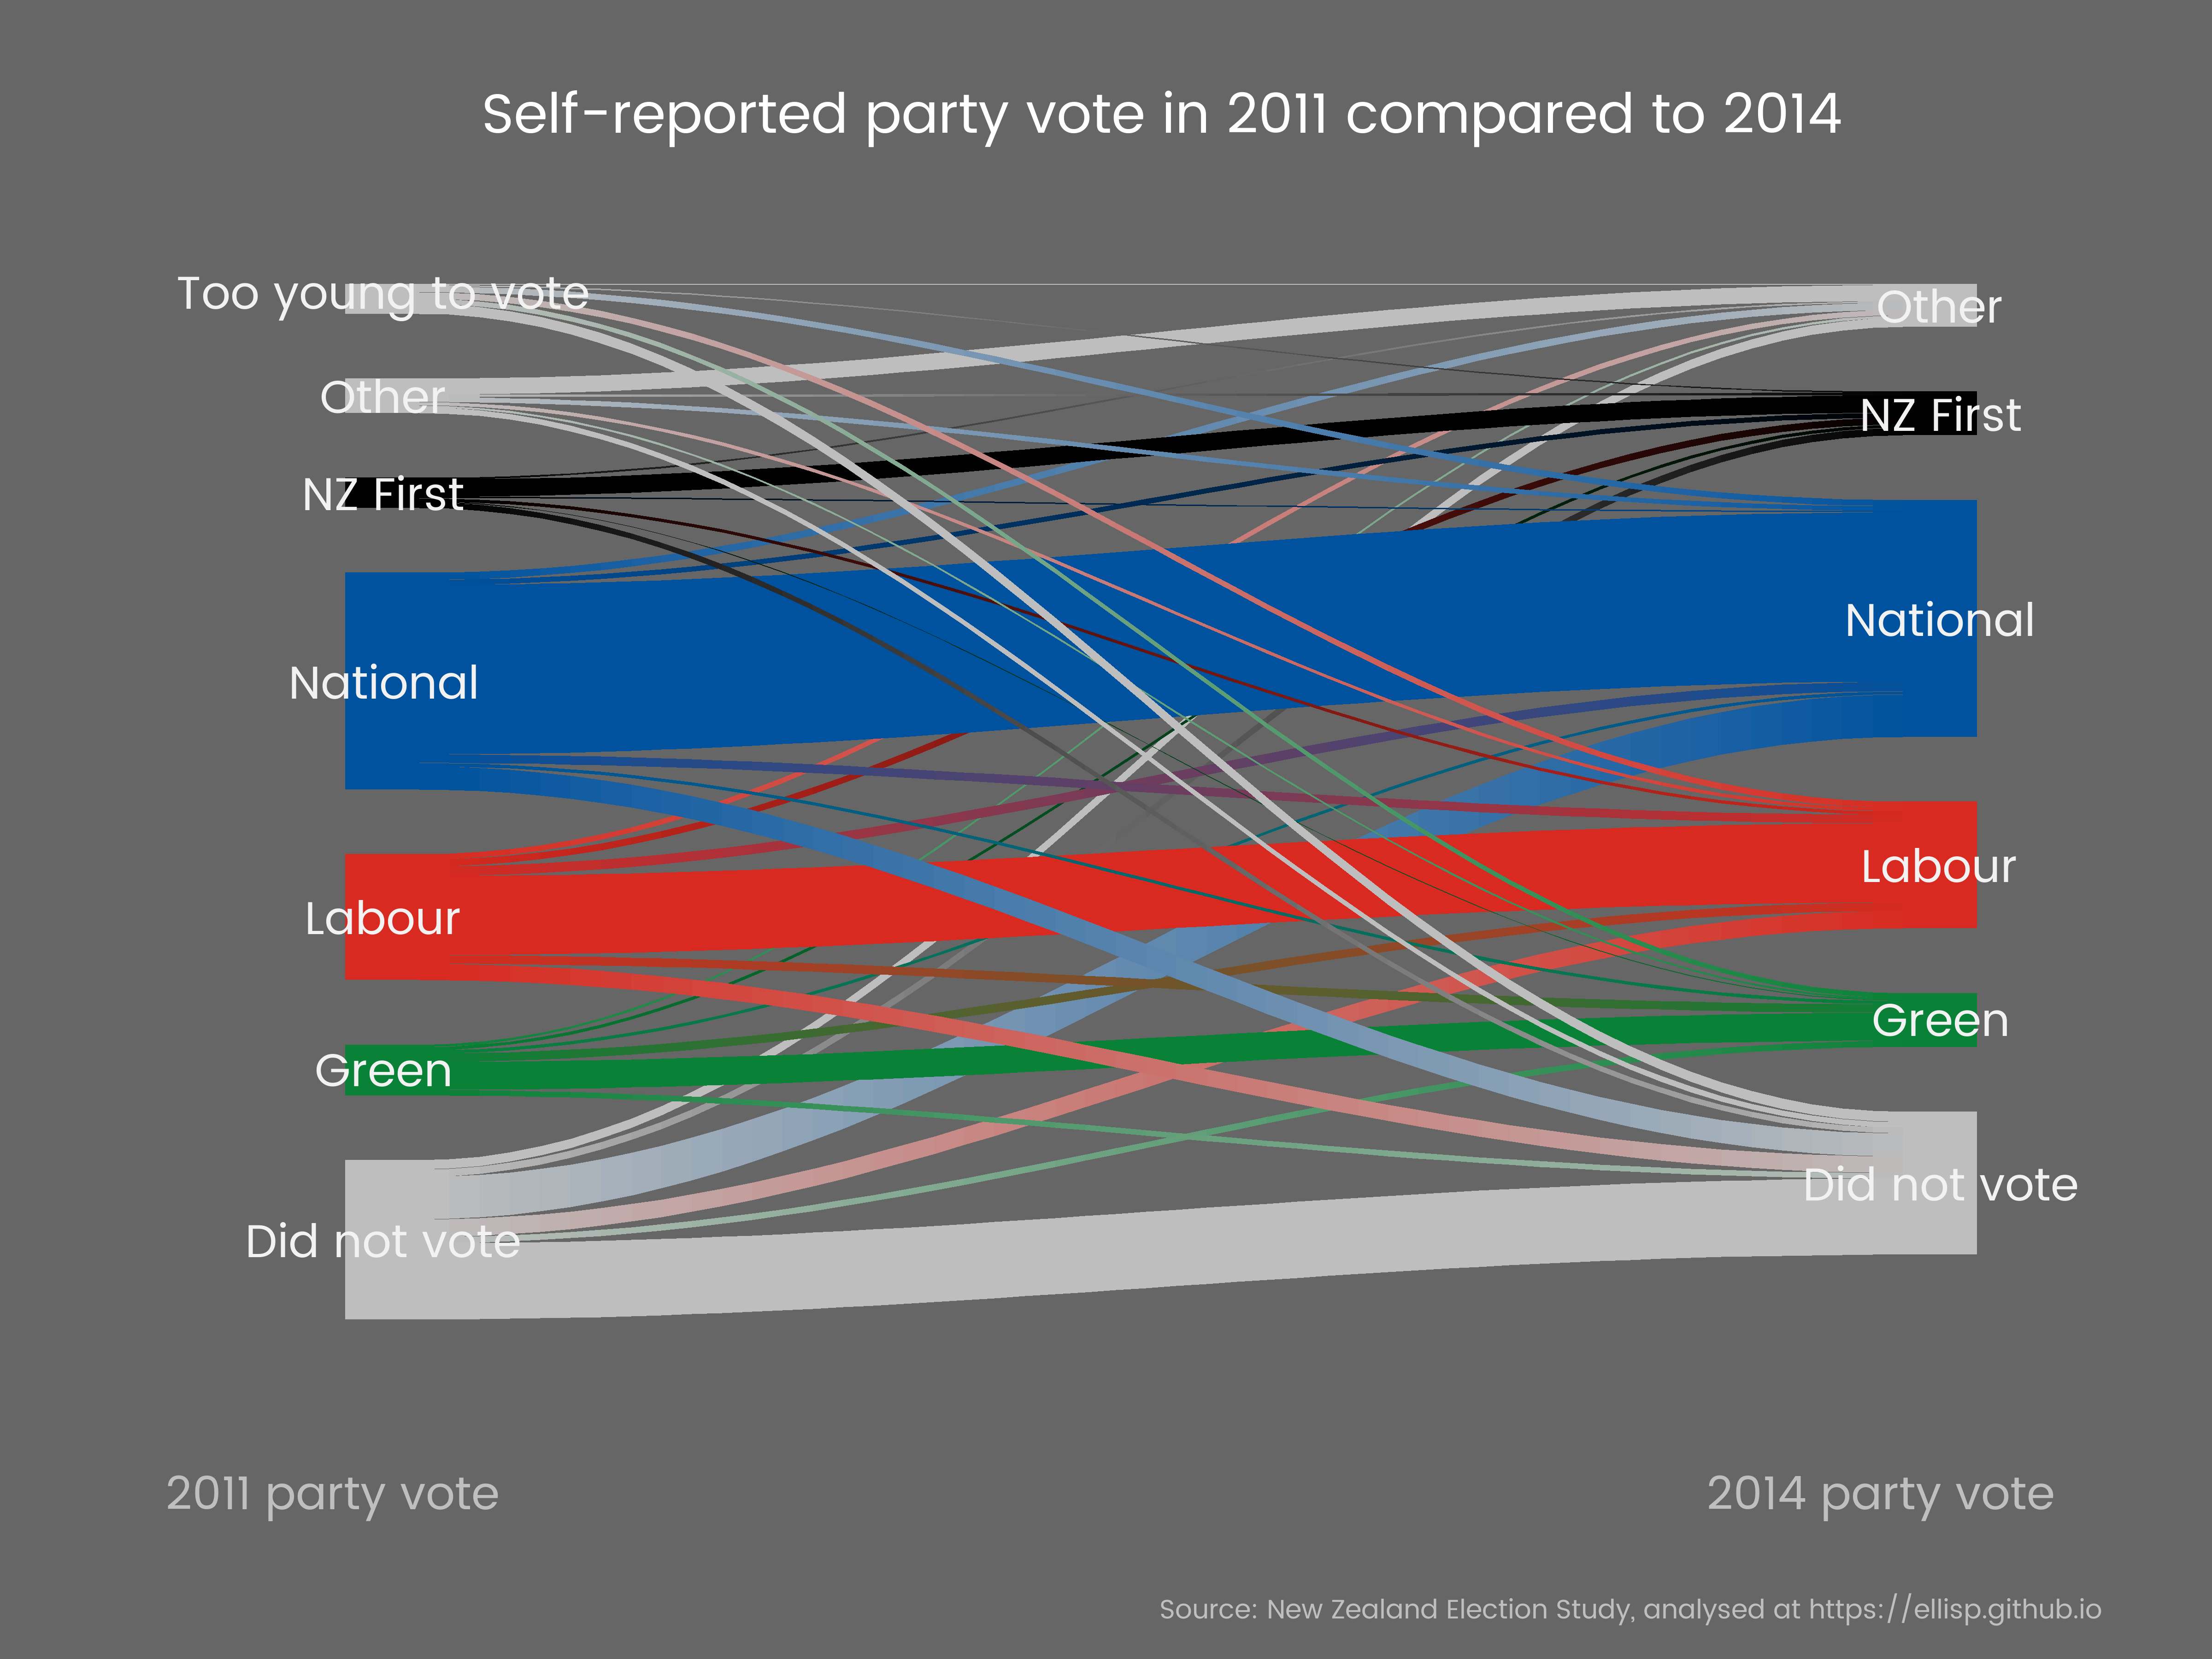
Sankey charts for swinging voters
21 May 2017
Sankey charts based on individual level survey data are a good way of showing change from election to election. I demonstrate this, via some complications with survey-reweighting and missing data, with the New Zealand Election Study for the 2014 and 2011 elections.
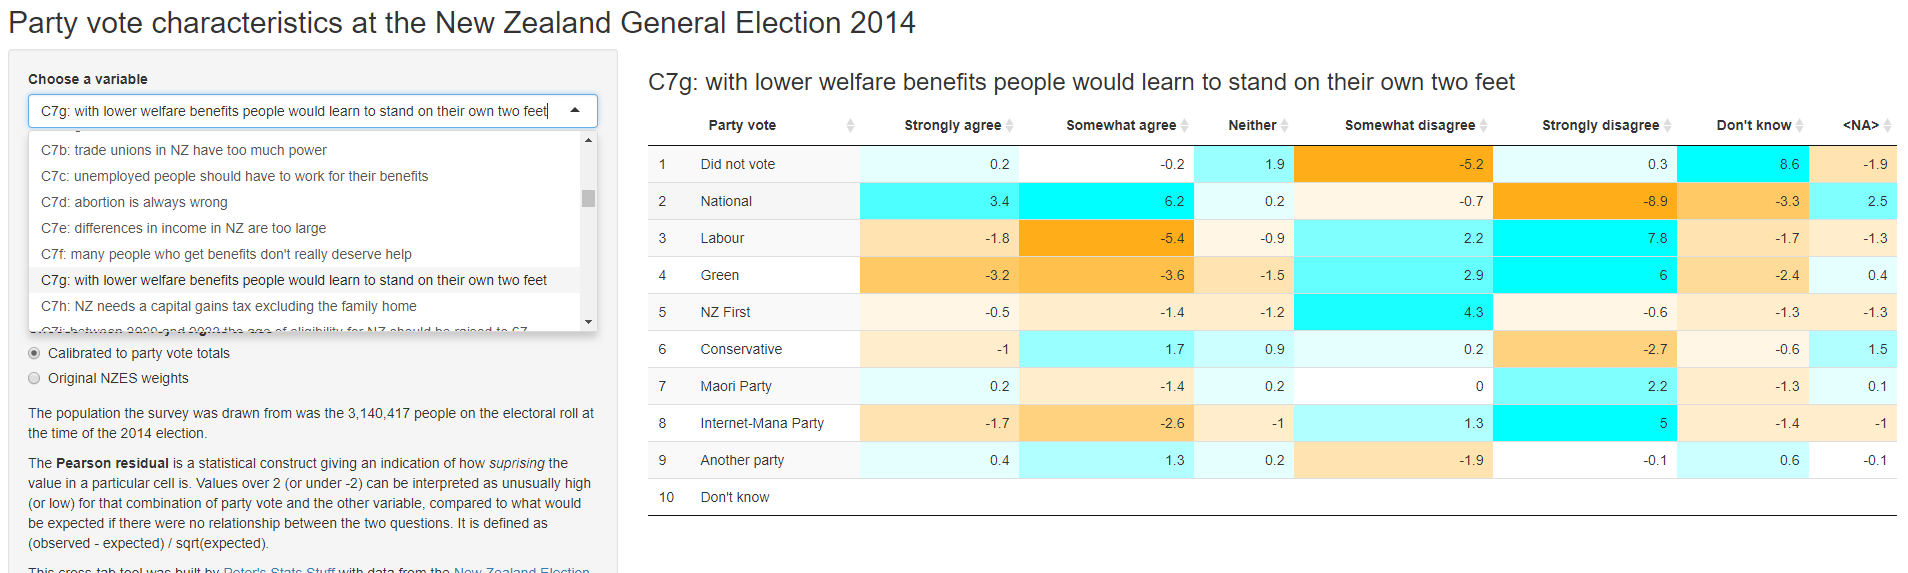
Web app for individual party vote from the 2014 New Zealand election study
14 May 2017
Introducing a Shiny web tool for exploring individual characteristics and party vote in the 2014 New Zealand general election.
Modelling individual party vote from the 2014 New Zealand election study
06 May 2017
I work through a fairly complete modelling case study utilising methods for complex surveys, multiple imputation, multilevel models, non-linear relationships and the bootstrap. People who voted for New Zealand First in the 2014 election were more likely to be older, born in New Zealand, identify as working class and male.

Luke-warm about micromaps
30 April 2017
Linked micromaps are an ok way of presenting data and are probably the right tool in some circumstances; but they're not as cool as I thought they might be.

More cartograms of New Zealand census data (district and city level)!
25 April 2017
Shapefiles for cartogram by New Zealand Territorial Authority (ie District or City), with area proportional to population in 2013, have been added to the nzcensus package on GitHub.

Cartograms of New Zealand census data
23 April 2017
Choropleth maps are useful ways of using fill colour to show densities, proportions and growth rates by political or economic boundaries, but can be visually problematic when large geographic areas represent few people, or small areas (ie cities) represent many. One solution is a cartogram, and I have a go at using them to present New Zealand census data in this post and accompanying shiny app.

House effects in New Zealand voting intention polls
21 March 2017
I use generalized additive models to explore "house effects" (ie statistical bias) in polling firms' estimates of vote in previous New Zealand elections.

New data and functions in nzelect 0.3.0 R package
11 March 2017
Version 0.3.0 of the nzelect R package now on CRAN includes historical polling data and a few convenience functions

Earthquake energy over time
19 November 2016
I look more into this business of energy from earthquakes.
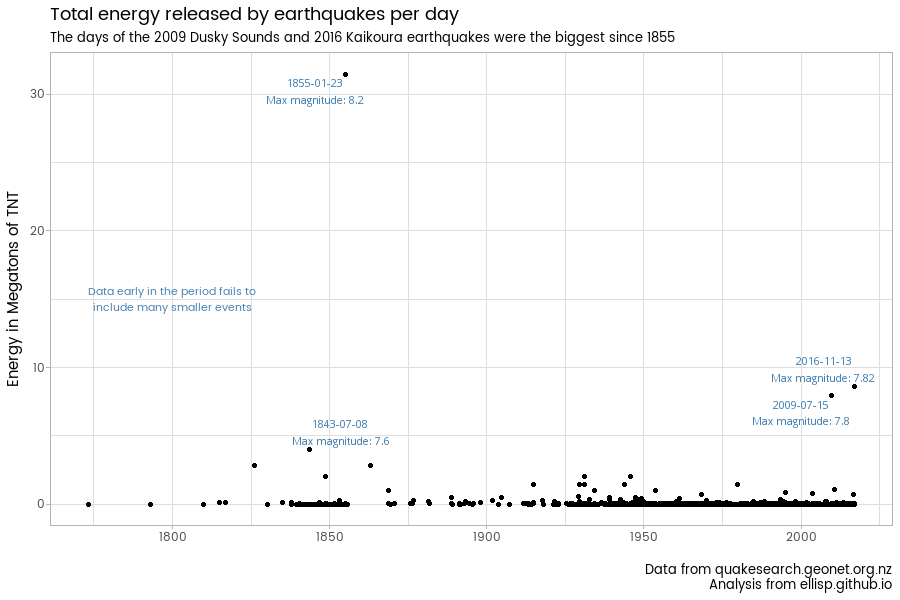
Extreme pie chart polishing
15 November 2016
I polish up a dramatic pie chart from stuff.co.nz on earthquake energy released in New Zealand over the last few years.

Statistics New Zealand experimental API initiative
15 October 2016
Statistics New Zealand recently launched experimental access to some of their data over the web via an application programming interface; it can be accessed easily via the equally experimental statsNZ R package by Jonathan Marshall.

Update of `ggseas` for seasonal decomposition on the fly
12 October 2016
ggseas 0.5.1 is available on CRAN.

New Zealand Election Study individual level data
18 September 2016
Individual level data on voting behaviour are freely available from the New Zealand Election Study and everyone should have a go at analysing them!

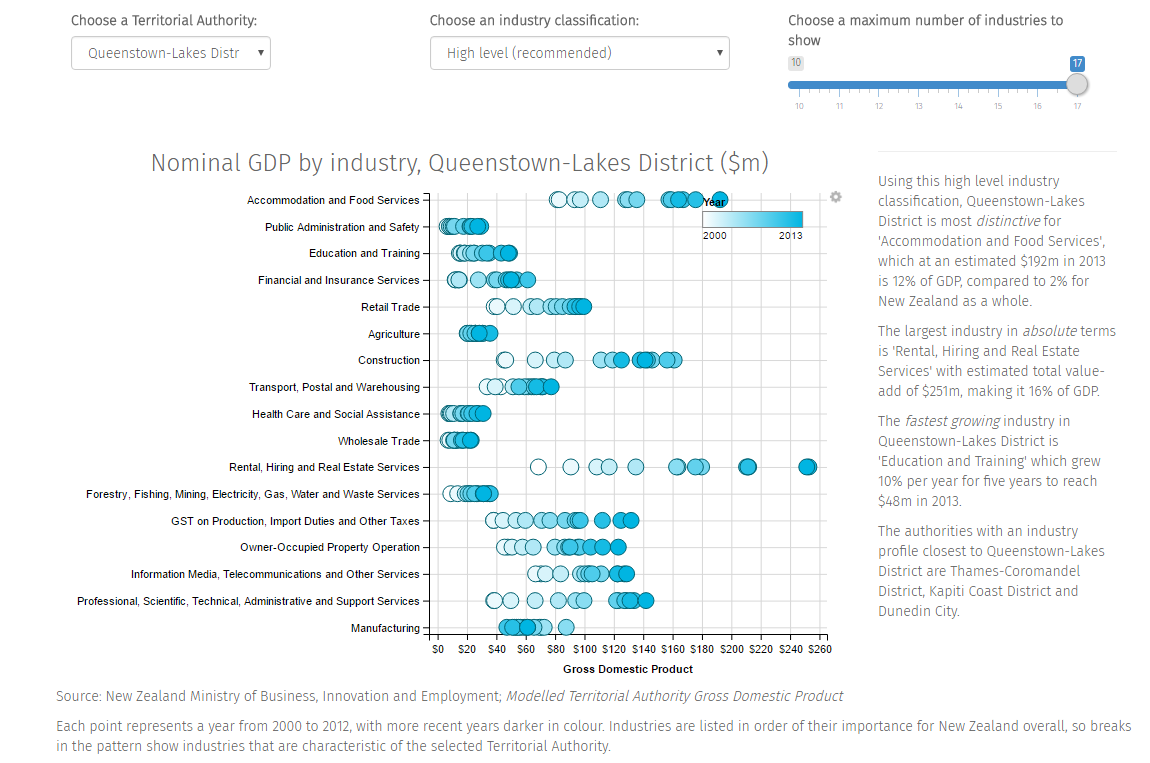
Analysing the Modelled Territorial Authority GDP estimates for New Zealand
13 September 2016
My presentation and paper on the development and use of "Modelled Territorial Authority Gross Domestic Product" for New Zealand, as presented to the New Zealand Association of Economists conference in June 2016
nzcensus on GitHub
04 August 2016
Demonstration analysis of area unit demographic data from the nzcensus R package on GitHub, which is approaching more maturity and readiness for general use.

nzelect 0.2.0 on CRAN
14 July 2016
The nzelect R package is now available on CRAN; so far it has aggregate results by voting place for the New Zealand 2014 general election.

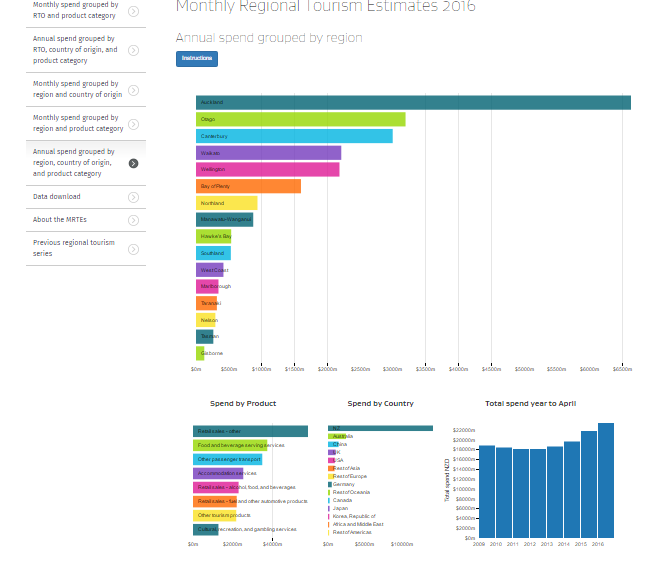
Monthly Regional Tourism Estimates
16 June 2016
My day-job released new data on estimated tourism spend by region in New Zealand, by month.
Visual contrast of two robust regression methods
22 May 2016
I use animations to show some of the properties of least trimmed squares compared to a Huber M estimator as alternative robust regression estimation methods for a simple linear models.
Election analysis contest entry part 4 - drivers of preference for Green over Labour party
16 April 2016
Locations with more self employed, people with Bachelor degrees, no religion, and people living overseas five years ago were more likely to vote Green over Labour in the 2014 New Zealand General Election, and locations with more ethnically Asian and Pacific people, people born in New Zealand, and people with no qualification returned higher votes for Labour over the Greens.

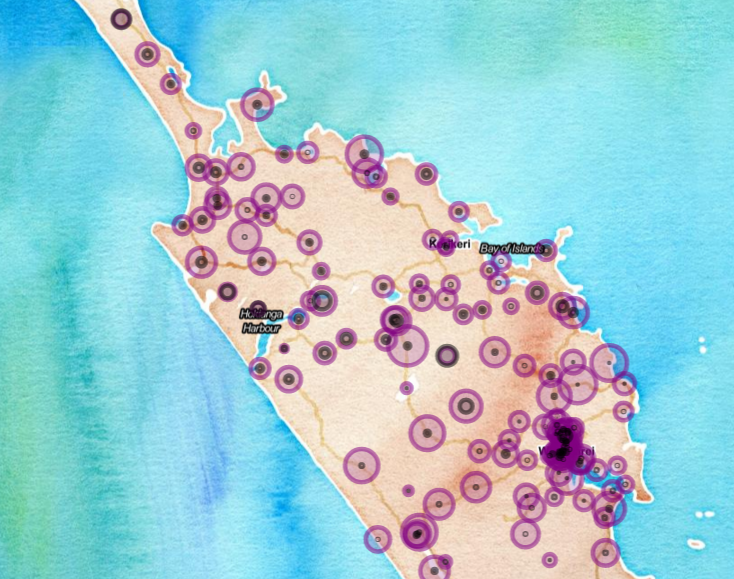
Election analysis contest entry part 3 - interactive exploration of voting locations with leaflet and Shiny
09 April 2016
I talk through some exploratory analysis of voting location with a Shiny application using the {nzelect} New Zealand General Election 2014 data.
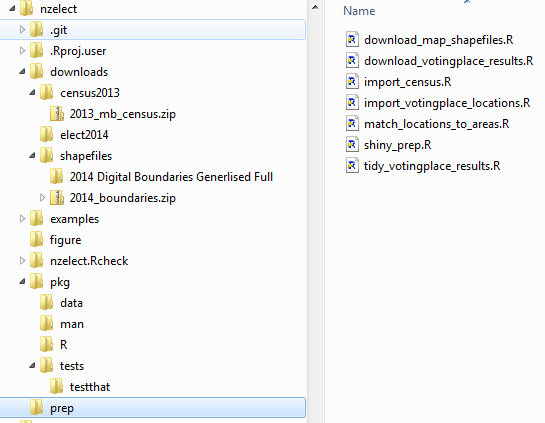
Election analysis contest entry part 2 - building the nzelect R package
04 April 2016
I explain the structure and techniques behind building the nzelect R package, which has New Zealand election results, in case anyone is interested or wants to adapt the process for other packages that rely on preparatory data munging.
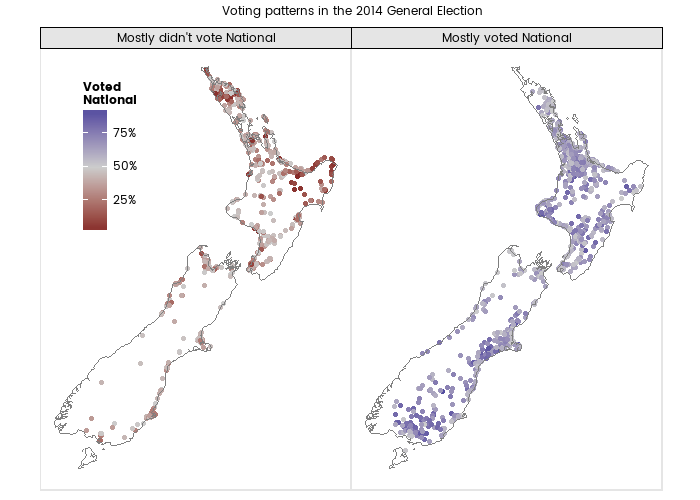
Election analysis contest entry part 1 - introducing the nzelect R package
03 April 2016
I introduce a new R package, with tidy versions of New Zealand election data (so far only for the 2014 general election). We confirm and discuss some well-known results such as the tendency for the Labour Party to apparently under-perform on party vote; and identify patterns at the Territorial Authority and Regional Council level that are not usually available due to how voting behaviour is normally classified and reported on.
Filling in the gaps - highly granular estimates of income and population for New Zealand from survey data
23 January 2016
I use Random Forests to create estimated income distributions for small (sometimes non-existent) subsets of the New Zealand population, using the 2011 New Zealand Income Survey. The estimated distributions are showcased in an interactive web app.
Network charts of commuting in New Zealand with R and D3
26 December 2015
Commuting patterns between districts and cities in New Zealand are used to illustrate static (for printing) and interactive (for the web) network charts with R and D3.

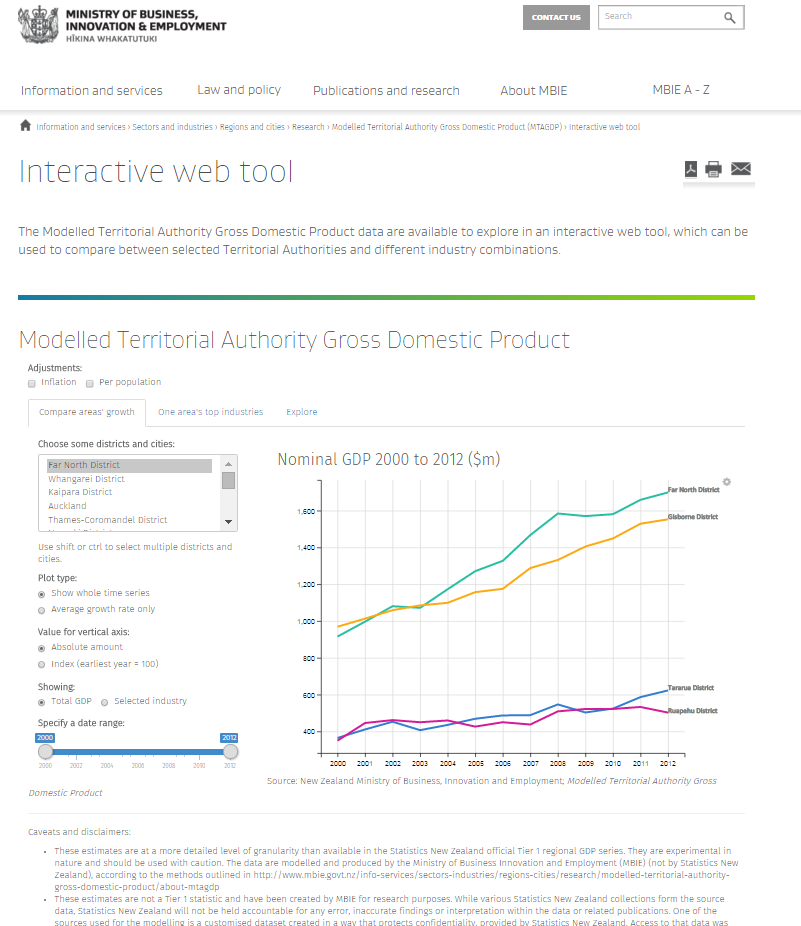
Modelled Territorial Authority GDP for New Zealand
30 October 2015
The Ministry of Business, Innovation and Employment (MBIE) published Modelled Territorial Authority Gross Domestic Product estimates for New Zealand 2000 to 2012 in October 2015, and plan to update annually from now on. The data, method and an interactive web app are on the MBIE website and the source code is available on GitHub.
Seasonal adjusment on the fly with X-13ARIMA-SEATS, seasonal and ggplot2
10 October 2015
I show how to seasonally adjust published electronic card transactions spend in New Zealand using the US Census Bureau's excellent X-13ARIMA-SEATS software, the Spanish SEATS algorithm and Christoph Sax's seasonal R package; and how to build a new "stat" for ggplot2 to make it easy to do seasonal adjustment on the fly for a graphic of a time series split by various grouping dimensions.

Sampling distribution of Gini coefficient
12 September 2015
I explore the sampling distributions of estimates of Gini coefficients from a sample, using the New Zealand Income Survey 2011. At the actual sample size of nearly 30,000, sampling error is negligible, and as low as a sample size of 1,000 a 95% confidence interval is (0.48, 0.55), precise enough for most purposes and certainly good enough given the non-sampling vagaries of the underlying data. I discuss why individual and weekly income data - which is all I have to hand - returns a higher measure of inequality than does annual household income, the more usual and internationally-comparable (and completely valid) measure.

Transforming the breaks to match a scale
07 September 2015
I follow up my ggplot2 version of John and Draper's modulus transformation from my last post. The default for creating new transformations using the {scales} package places the breaks for gridlines and labels in the scale at regular intervals on the original untransformed scale; I explore how to adjust for this.

Creating a scale transformation
05 September 2015
It's easy to define a new transformation with Hadley Wickham's {scales} package, and I do this for John and Draper's modulus transform proposed in 1980 as a way of dealing with data with zero and negative values where logarithmic or Box-Cox transformations fail. This makes it easy to integrate this useful transformation, which works for negative numbers and is continuous through zero, into graphical data analysis.

A better way of visualising income distributions with zeroes and negatives
21 August 2015
I demonstrate a better way of visualising income distributions when they include zero and negative values rather than just putting them on a logarithmic scale and dropping the inconvenient values. I use a modified power transformation, which applies a transformation like square root to the absolute value of the original variable and then restores the sign. I apply the method to the New Zealand Income Survey 2011 data.

Importing the New Zealand Income Survey SURF
15 August 2015
I tidy up the publicly available simulated unit record file (SURF) of the New Zealand Income Survey 2011, import into a database, and explore income distributions, visualising the lower distribution of weekly incomes New Zealanders of Maori and Pacific Islander ethnicity. Along the way I create a function to identify modes in a multi-modal distribution.

New Zealand Data & APIs on GitHub
01 August 2015
I discuss a new listing of datasets in New Zealand, and demonstrate tidying up a publicly available dataset on number of welfare beneficiaries for use in an interactive web application.
