Overview
How big a sample size would you think you need to get a reliable 95% confidence interval (ie one that really does contain the true value 95% of the time) for a single univariate statistic like standard deviation? 30? 50? Turns out the answer is more like 20,000 for some not-particularly-extreme real-world data.
In this post I explore the phenomenon shown in the first chart below; lower than hoped-for coverage of 95% confidence intervals calculated with the bootstrap when estimating a population standard deviation from a modest sample size.

The test is admittedly a tough one, albeit realistic. The population data from which my samples are drawn are the simulated unit record file microdata from Statistics New Zealand’s New Zealand Income Survey 2011, which I’ve written about in numerous posts. The distribution of weekly income in this data set is complex; it could perhaps be described as a mixture of:
- individuals with positive income that is approximately log-normal distributed;
- individuals with negative income of some difficult-to-describe distribution;
- a large spike of individuals with zero income; plus a sprinkling of outliers.
In fact, it looks like this:

The actual standard deviation of all 29,471 observations of income is $806.
The inference problem is how to estimate that value if you have only a smaller sample, eg 50? Because if you have only 50 observations, you think the data looks like this:

In the case of this particular sample of 50, the standard deviation is $527.
Unbiased estimate of standard deviation
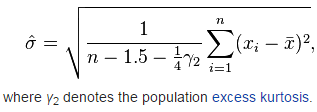
The first challenge - although it turns out to be a relatively small detail in terms of the challenge - is to get the best estimator for the situation when you want to estimate a population’s standard deviation from a sample. While an unbiased estimator of variance is well known, standard deviation (the square root of variance) is complex. Creating an unbiased estimator of standard deviation turns out to depend on the vagaries of the shape of the original population, with the fourth moment (expected value of the variable to the power of four) playing a role.
A reasonably generally well-performing estimator for non-Normal variables is reportedly (image from the Wikipedia article linked to above):
Method
Using the unbiased estimate of standard deviation above, I set out to test the performance of bootstrap confidence intervals in covering the true value of population standard deviation for sample sizes of 50, 100, 200, 400, …, 12800. I took 2,500 samples of the data for each of these sample sizes; estimated the standard deviation from each sample; and use the bootstrap to estimate confidence intervals for population standard deviation from each sample, with 499 bootstrap replicates. I tested both the basic and the percentile methods for bootstrap confidence intervals. To reduce the complications of my finite population, each of the 2,500 samples is taken with replacement from the original data set.
Results - income
The unbiased estimator works ok, at least in terms of bias. Here’s the full distribution of the estimated standard deviation from all those different samples:

For the smaller samples, it’s obvious that most of the estimates are to the left of the blue line ie the estimated standard deviation is less than the true standard deviation from the full 29,471 observations. However, this frequent underestimation is compensated for by the fact that when the standard deviation is over-estimated, it tends to be by quite a lot - with a strong rightwards skew in the distribution of this statistic for all the smaller sample sizes. This all sounds bad of course, but it is the sort of thing that’s needed if a statistic with a skewed sampling distribution is going to be on average unbiased. We see how this plays out when we look at the actual average error of the estimator:

There’s a slight bias to under-estimation for smaller sample sizes (six percent isn’t that much in the scheme of things), but by the time sample size is 800 or higher the estimator on average gets it pretty much right.
It’s the coverage of the bootstrapped confidence intervals that is disappointing however. Here’s a repeat of that graphic I started the post with:
Basically, when you have a really complex mixed and dirty variable like this one (New Zealand weekly income from survey data), not until you have a sample size of 20,000 or so do your bootstrapped confidence intervals start to have the coverage that is planned for them.
What’s going on here? Well, the bootstrap depends on you taking many re-samples with replacements from your original sample, in the hope that doing this mimics the behaviour of taking many samples from the whole population which isn’t possible for reasons of expense or logistics. For this to work, the original sample has to sufficiently resemble the whole population that the resamples from the sample behave similarly to samples from the population. There’s no straightforward definition of “sufficiently resemble” that I know of, but what we’re seeing here is that until the sample size is really quite moderately large, for a statistic like standard deviation for a moderately complex population distribution, the sample does not “sufficiently resemble” the population for the bootstrap to work as advertised.
Results - other variables
To get more of a feel for what was going on here, I ran the same computer program over more regular, simulated data:
- a standard normal distribution (mean zero, variance one)
- a standard uniform distribution (bounded by zero and one)
- a standard log-normal distribution (e to the power of standard normal)
- a mixture of all three
The results in terms of confidence interval coverage can be seen in this graphic:

Points to make from this are:
- In all cases the “basic” and “percentile” methods perform similarly, with neither of the two consistently outperforming the other for the two symmetrical distributions, but percentile performing slightly better for the two asymmetrical distributions.
- For the two symmetrical distributions - uniform and normal - the coverage at small sample sizes isn’t bad. Even with only 50 observations in the sample, more than 90% of the confidence intervals contain the true value, and the sample size doesn’t need to be much larger than that before it gets up to the desired 95%.
- In contrast, for the non-symmetrical, right-skewed log-normal data and the mixture distribution, the success rate of 95% confidence intervals actually containing the true value is relatively low until the sample size is many thousands, and it never reaches (with the sample sizes tested) the desired 95% rate.
Mixed or “contaminated” distributions are known to cause problems for statistical inference (although I don’t like the word “contaminated” as too value-laden - as though it is the data’s fault it doesn’t live up to twentieth century simplifying assumptions!). The bootstrap was part of the late twentieth century revolution in applied statistical methods to help address those and other problems, but the observations in this post confirm that it doesn’t magically make them go away.
“Classic, routinely used statistical methods are based on the assumptions that observations follow a normal curve. It was once thought that violating the normality assumption rarely had a detrimental impact on these methods, but theoretical and empirical advances have made it clear that general types of non-normality cause serious practical problems in a wide range of commonly occurring situations. Indeed, even very slight departures from normality can be a source of concern.”
Wilcox, Modern Statistics for the Social and Behavioral Sciences
Simpler statistics
Finally, to round out the picture I tried the same approach on statistics that are simpler than standard deviation - mean and trimmed mean - on the same awkward weekly income data.
The confidence interval coverage is pretty satisfactory even with small sample sizes, hovering close to the desired 95%.

And as expected from theoretical results, there’s no discernable bias:

Conclusion
The overall conclusion: standard deviation of non-normal(skewed, contaminated, or both) distributions is a really tough statistic to get a valid confidence interval for. But a simple statistic (like mean) for an awkward distribution - or standard deviation of a simple distribution (like Normal or Uniform) - perform fine.
Code
Here’s the computer programs, all in R.
First I load up the packages I’m using. This is fairly straightforward. The moments package is needed because I need to estimate excess kurtosis as part of the formula for an unbiased estimate of standard deviation
#===================setup=======================
library(ggplot2) # using the dev version from GitHub so can have subtitles and captions
library(scales)
library(boot)
library(dplyr)
library(moments) # for kurtosis()
library(tidyr)
library(gridExtra) # for grid.arrange()

# themes for graphics
theme_set(theme_light(10) )
theme_small <- theme_light(8) +
   theme(axis.text.x = element_text(angle = 45, hjust = 1))
Next I create two functions. One is unbiased standard deviation of a vector x, to be scrambled/resampled by means of the index i - the sort of function that is accepted by the boot function as a statistic:
#==========Functions==================
sampsd <- function(x, i, xbar = mean(x)){
   # function suitable for boot which returns estimated standard deviation
   # from a sample x that has been scrambled by the index i
   d <- x[i]
   n <- length(d)

   # this next formula is the best general approximation to a general
   # unbiased estimator of standard deviation from a non-normal distribution
   # https://en.wikipedia.org/wiki/Unbiased_estimation_of_standard_deviation
   unbiased_sd <- sqrt(
      sum((d - xbar) ^ 2) /
         (n - 1.5 - (kurtosis(d) - 3) / 4)
   )
   return(unbiased_sd)
}
Second is the main routine that performs the actual testing of the confidence interval. This is little involved so I won’t try to explain it line by line. Hopefully the in-function comments are adequate:
test_boot_ci <- function(full_data,
                         statistic,
                         truevalue = statistic(full_data, i = 1:length(full_data)),
                         reps = 50,
                         R = 499,
                         title = match.call()){

   # Function to explore the coverage of basic and percentile bootstrap
   # 95% confidence intervals.
   #' @full_data A full population of data from which samples of various sizes
   #           will be drawn without replacement, and each of those samples will
   #           be analysed with the bootstrap as though it were all that is
   #           available.
   #' @statistic a function suitable for passing to the statistic argument of boot
   #           ie first argument is data, second argument is an index for
   #           scrambling the data
   #' @truevalue true value that the statistic is trying to esimate.
   #' @reps number of repeats of each sample size to analyse
   #' @R number of bootstrap resamples for each sample
   #' @title Title for plots


   # create a data frame to hold the results, with "reps" rows for each
   # sample size from 50, 100, 200, ..., 12800
   ns <- rep(2 ^ (0:8) * 50, each = reps)
   results <- data.frame(
      n = ns,
      point_est = numeric(length(ns)),
      ci_basic_correct = logical(length(ns)),
      ci_perc_correct = logical(length(ns))
   )


   # Create point estimates and two types of bootstrap confidence interval
   # for each repetition at each value of sample size:
   for(i in 1:nrow(results)){

      this_data <- full_data[sample(1:length(full_data), results[i, "n"], replace = TRUE)]
      res <- boot(this_data, statistic = statistic, R = R)

      results[i, "point_est"] <- res$t0

      ciobj <- boot.ci(res, type = "basic")
      citest <- (truevalue > ciobj$basic[4] & truevalue < ciobj$basic[5])
      results[i, "ci_basic_correct"] <- citest

      ciobj <- boot.ci(res, type = "perc")
      citest <- (truevalue > ciobj$perc[4] & truevalue < ciobj$perc[5])
      results[i, "ci_perc_correct"] <- citest

   }

   # Prepare summary table and plots for output
   tab <- results %>%
      group_by(n) %>%
      summarise(coverage_basic = round(sum(ci_basic_correct) / length(ci_basic_correct), 3),
                coverage_perc =  round(sum(ci_perc_correct) / length(ci_perc_correct), 3),
                bias = round((mean(point_est) - truevalue) / truevalue, 3))

   p1 <- tab %>%
      dplyr::select(-bias) %>%
      gather(Method, value, -n) %>%
      mutate(Method = gsub("coverage_perc", "Percentile", Method),
             Method = gsub("coverage_basic", "Basic", Method),
             Method = factor(Method, levels = c("Percentile", "Basic"))) %>%
      ggplot(aes(x = n, y = value, color = Method)) +
      geom_hline(yintercept = 0.95, colour = "blue") +
      geom_point() +
      geom_line() +
      scale_y_continuous("Proportion of 95% confidence intervals\nthat include true value",
                         label = percent) +
      scale_x_sqrt("Sample size", label = comma, breaks = unique(ns)) +
      labs(colour = "Bootstrap\nmethod") +
      ggtitle(title) +
      theme(axis.text.x = element_text(angle = 45, hjust = 1))

   p2 <- tab %>%
      ggplot(aes(x = n, y = bias)) +
      geom_hline(yintercept = 0, colour = "blue") +
      geom_point() +
      geom_line() +
      scale_y_continuous("Bias (as percentage of true value)",
                         label = percent) +
      scale_x_sqrt("Sample size", label = comma, breaks = unique(ns)) +
      ggtitle(title)

   p3 <- results %>%
      mutate(n = paste("n =", n),
             n = factor(n, levels = paste("n =", unique(ns) ) ) ) %>%
      ggplot(aes(x =point_est)) +
      geom_density(fill = "grey75", alpha = 0.5) +
      geom_rug() +
      facet_wrap(~n, scales = "free_y") +
      geom_vline(xintercept = truevalue, colour = "blue") +
      ggtitle(title) +
      labs(x = "Point estimates (blue line shows true value)")

   return(list(tab = tab, p1 = p1, p2 = p2, p3 = p3))

}
Next I load in the data, and apply my testing program to the income data and to the various simulated datasets needed for the blog.
Note that with the settings in the code below, nearly 1.25 million sets of data are analysed for each call to test_boot_ci(), so it takes overnight to run the whole thing on my laptop. The reps_per_sample_size and reps_per_bootstrap variables should be set to much lower values (eg 20 and 99) if you just want to give this a go, or to adapt it.
if(!exists("nzis")){
   nzis <- read.csv("http://www.stats.govt.nz/~/media/Statistics/services/microdata-access/nzis11-cart-surf/nzis11-cart-surf.csv")
}


reps_per_sample_size <- 2500
reps_per_bootstrap <- 499

#------------standard deviation of income data------------
income_sd <- test_boot_ci(full_data = nzis$income,
                            statistic = sampsd,
                            reps = reps_per_sample_size,
                            R = reps_per_bootstrap,
                            title = "Estimating standard deviation from income data")

#---------standard deviation of simulated data--------------
normal_sd <- test_boot_ci(full_data = rnorm(300000),
                          statistic = sampsd,
                          reps = reps_per_sample_size,
                          R = reps_per_bootstrap,
                          title = "Estimating standard deviation from simulated Normal data")

unif_sd <- test_boot_ci(full_data = runif(300000),
                        statistic = sampsd,
                        reps = reps_per_sample_size,
                        R = reps_per_bootstrap,
                        title = "Estimating standard deviation from simulated uniform data")

lognormal_sd <- test_boot_ci(full_data = exp(rnorm(300000)),
                             reps = reps_per_sample_size,
                             statistic = sampsd,
                             R = reps_per_bootstrap,
                             title = "Estimating standard deviation from simulated log-normal data")


mixture <- c(exp(rnorm(100000)), rnorm(100000), runif(100000))
mixture_sd <- test_boot_ci(full_data = mixture,
                             reps = reps_per_sample_size,
                             statistic = sampsd,
                             R = reps_per_bootstrap,
                             title = "Estimating standard deviation from simulated mixture data")


#-------simpler statistics on income data-----------
income_mean <- test_boot_ci(full_data = nzis$income,
                            statistic = function(x, i){mean(x[i])},
                            reps = reps_per_sample_size,
                            R = reps_per_bootstrap,
                            title = "Estimating mean from income data")

income_trmean <- test_boot_ci(full_data = nzis$income,
                              statistic = function(x, i){mean(x[i], tr = 0.2)},
                              reps = reps_per_sample_size,
                              R = reps_per_bootstrap,
                              title = "Estimating trimmed mean from income data")
Finally, I present the results in the graphics used in this post:
#------------Density of income data---------------
ggplot(nzis, aes(x = income)) +
   geom_density(fill = "grey75", alpha = 0.5) +
   geom_rug() +
   scale_x_continuous("Weekly income", label = dollar) +
   ggtitle("New Zealand Income Survey 2011", subtitle = "Full data")

set.seed(123)
ggplot(nzis[sample(1:nrow(nzis), 50), ], aes(x = income)) +
   geom_density(fill = "grey75", alpha = 0.5) +
   geom_rug() +
   scale_x_continuous("Weekly income", label = dollar) +
   ggtitle("New Zealand Income Survey 2011", subtitle = "Subsample of 50")

#-----------standard deviation of income--------------
income_sd$p1  +
   labs(caption = "Source: New Zealand Income Survey 2011, Statistics New Zealand"))

income_sd$p2

income_sd$p3

#----------------other distributions--------------
grid.arrange(
   normal_sd$p1 + theme_small,
   unif_sd$p1 + theme_small,
   lognormal_sd$p1 + theme_small,
   mixture_sd$p1 + theme_small
)

#----------------mean and trimmed mean-----------------
grid.arrange(
   income_mean$p1 + theme_small,
   income_trmean$p1 + theme_small,
   ncol = 2
)

grid.arrange(
   income_mean$p2 +
      theme_small +
      scale_y_continuous(limits = c(-0.05, 0.05), label = percent),
   income_trmean$p2 +
      theme_small +
      scale_y_continuous(limits = c(-0.05, 0.05), label = percent),
   ncol = 2
)