Pacific island energy supply
30 March 2026
Pacific island countries are heavily dependent on imported diesel, gas and kerosene for electricity generation and for cooking.

Pacific island demograpy, the narrative
22 March 2026
Pacific island populations are shaped by people movements, more than is the case for most countries in the world. Ease of migration—because of history, culture or international agreements—has a critical impact on population size, growth and shape; and the fundamentals of the economy.

Pacific island remittances
08 March 2026
Pacific island countries have some of the highest dependencies in the world on remittance payments from overseas.

Pacific island population pyramids (again)
01 March 2026
Population pyramids for Pacific countries, one or two at a time. I use these to highlight contrasts between two coral atoll nations, one of which has free movement to a large, rich country, and one of which doesn't.

Pacific diaspora
18 February 2026
Some Pacific countries have dramatically more of "their" people living overseas than in the origin country. And some don't.

The world's biggest 'Pacific' cities
16 February 2026
My best hasty effort at presenting the cities around the world with the most Pacific Islanders resident.

New Caledonia's nickel exports
01 January 2026
Accessing data and drawing charts for nickel exports from New Caledonia, and world nickel prices, from 2008 to 2025.

Net migration in Pacific island countries
04 December 2025
Accessing data and drawing visualisations of net migration for Pacific island countries and territories.

Visual summaries of population in Pacific islands
30 November 2025
Accessing population data for the Pacific and drawing two visual summaries of its recent and projected growth and absolute size, as used recently in a side event before the Pacific Heads of Planning and Statistics meeting in Wellington.

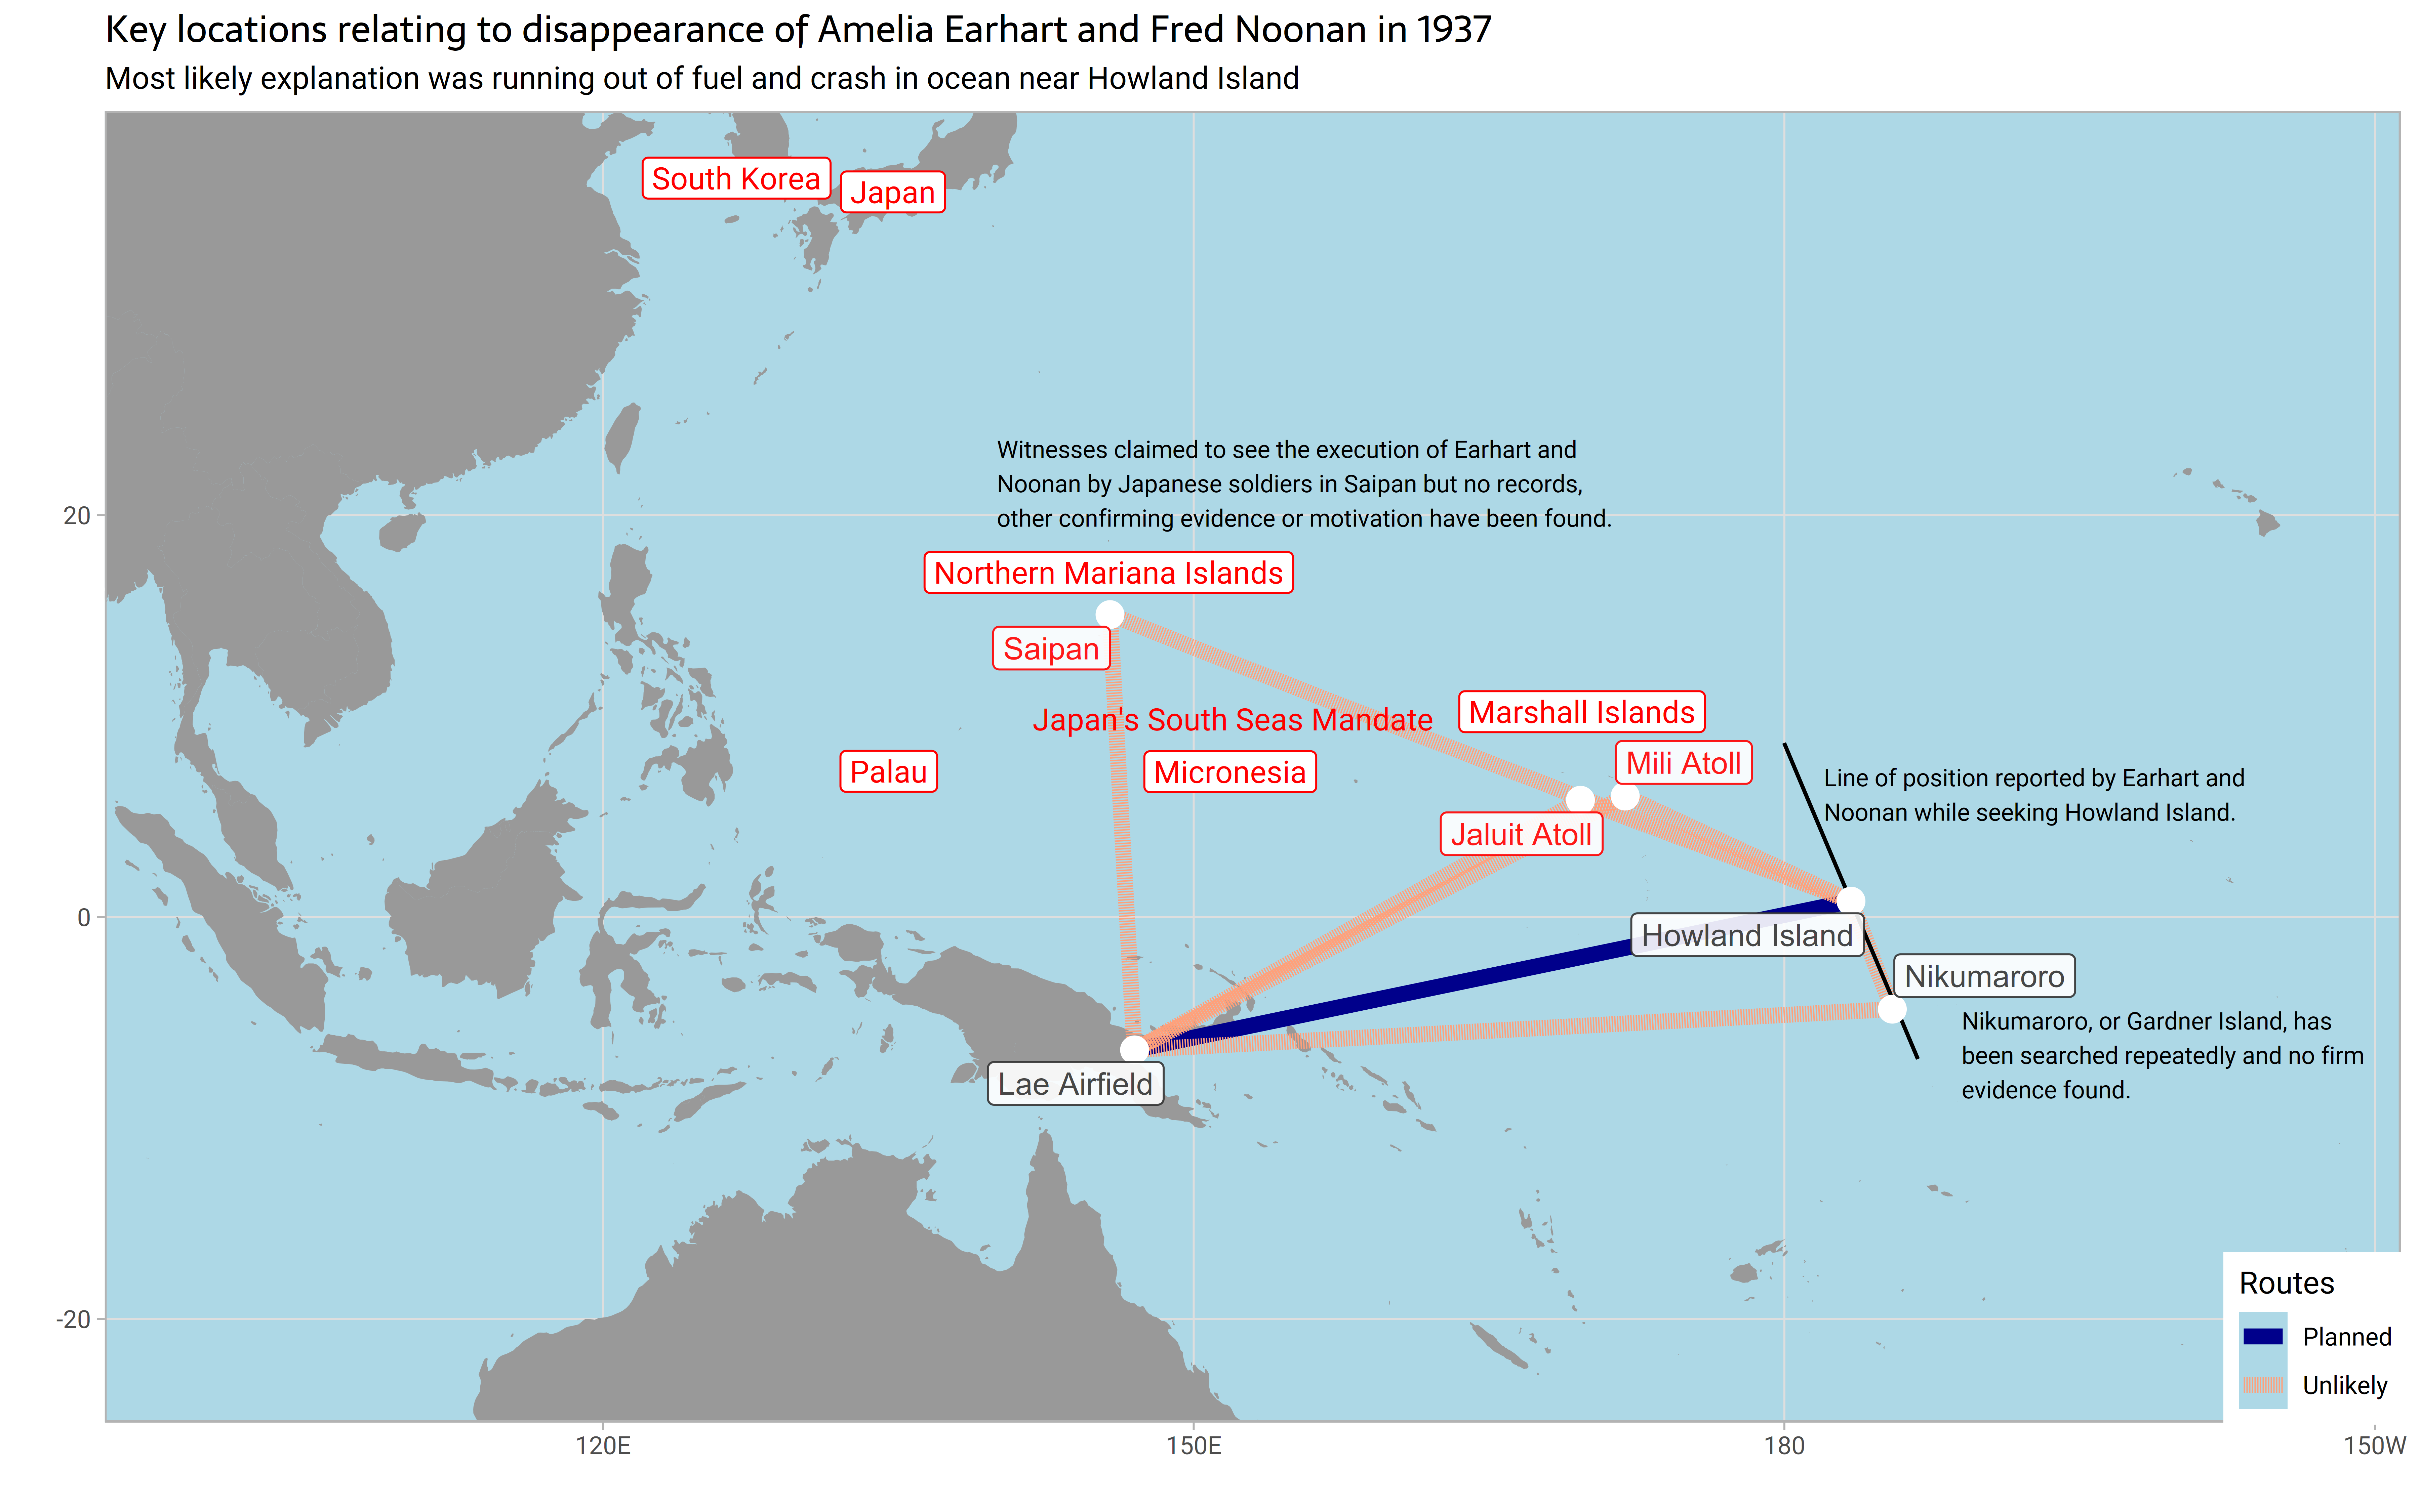
Mapping locations related to the Amelia Earhart disappearance
05 October 2025
I draw a map of the Pacific showing the key locations associated with the disappearance of Amelia Earhart and Fred Noonan in 1937.
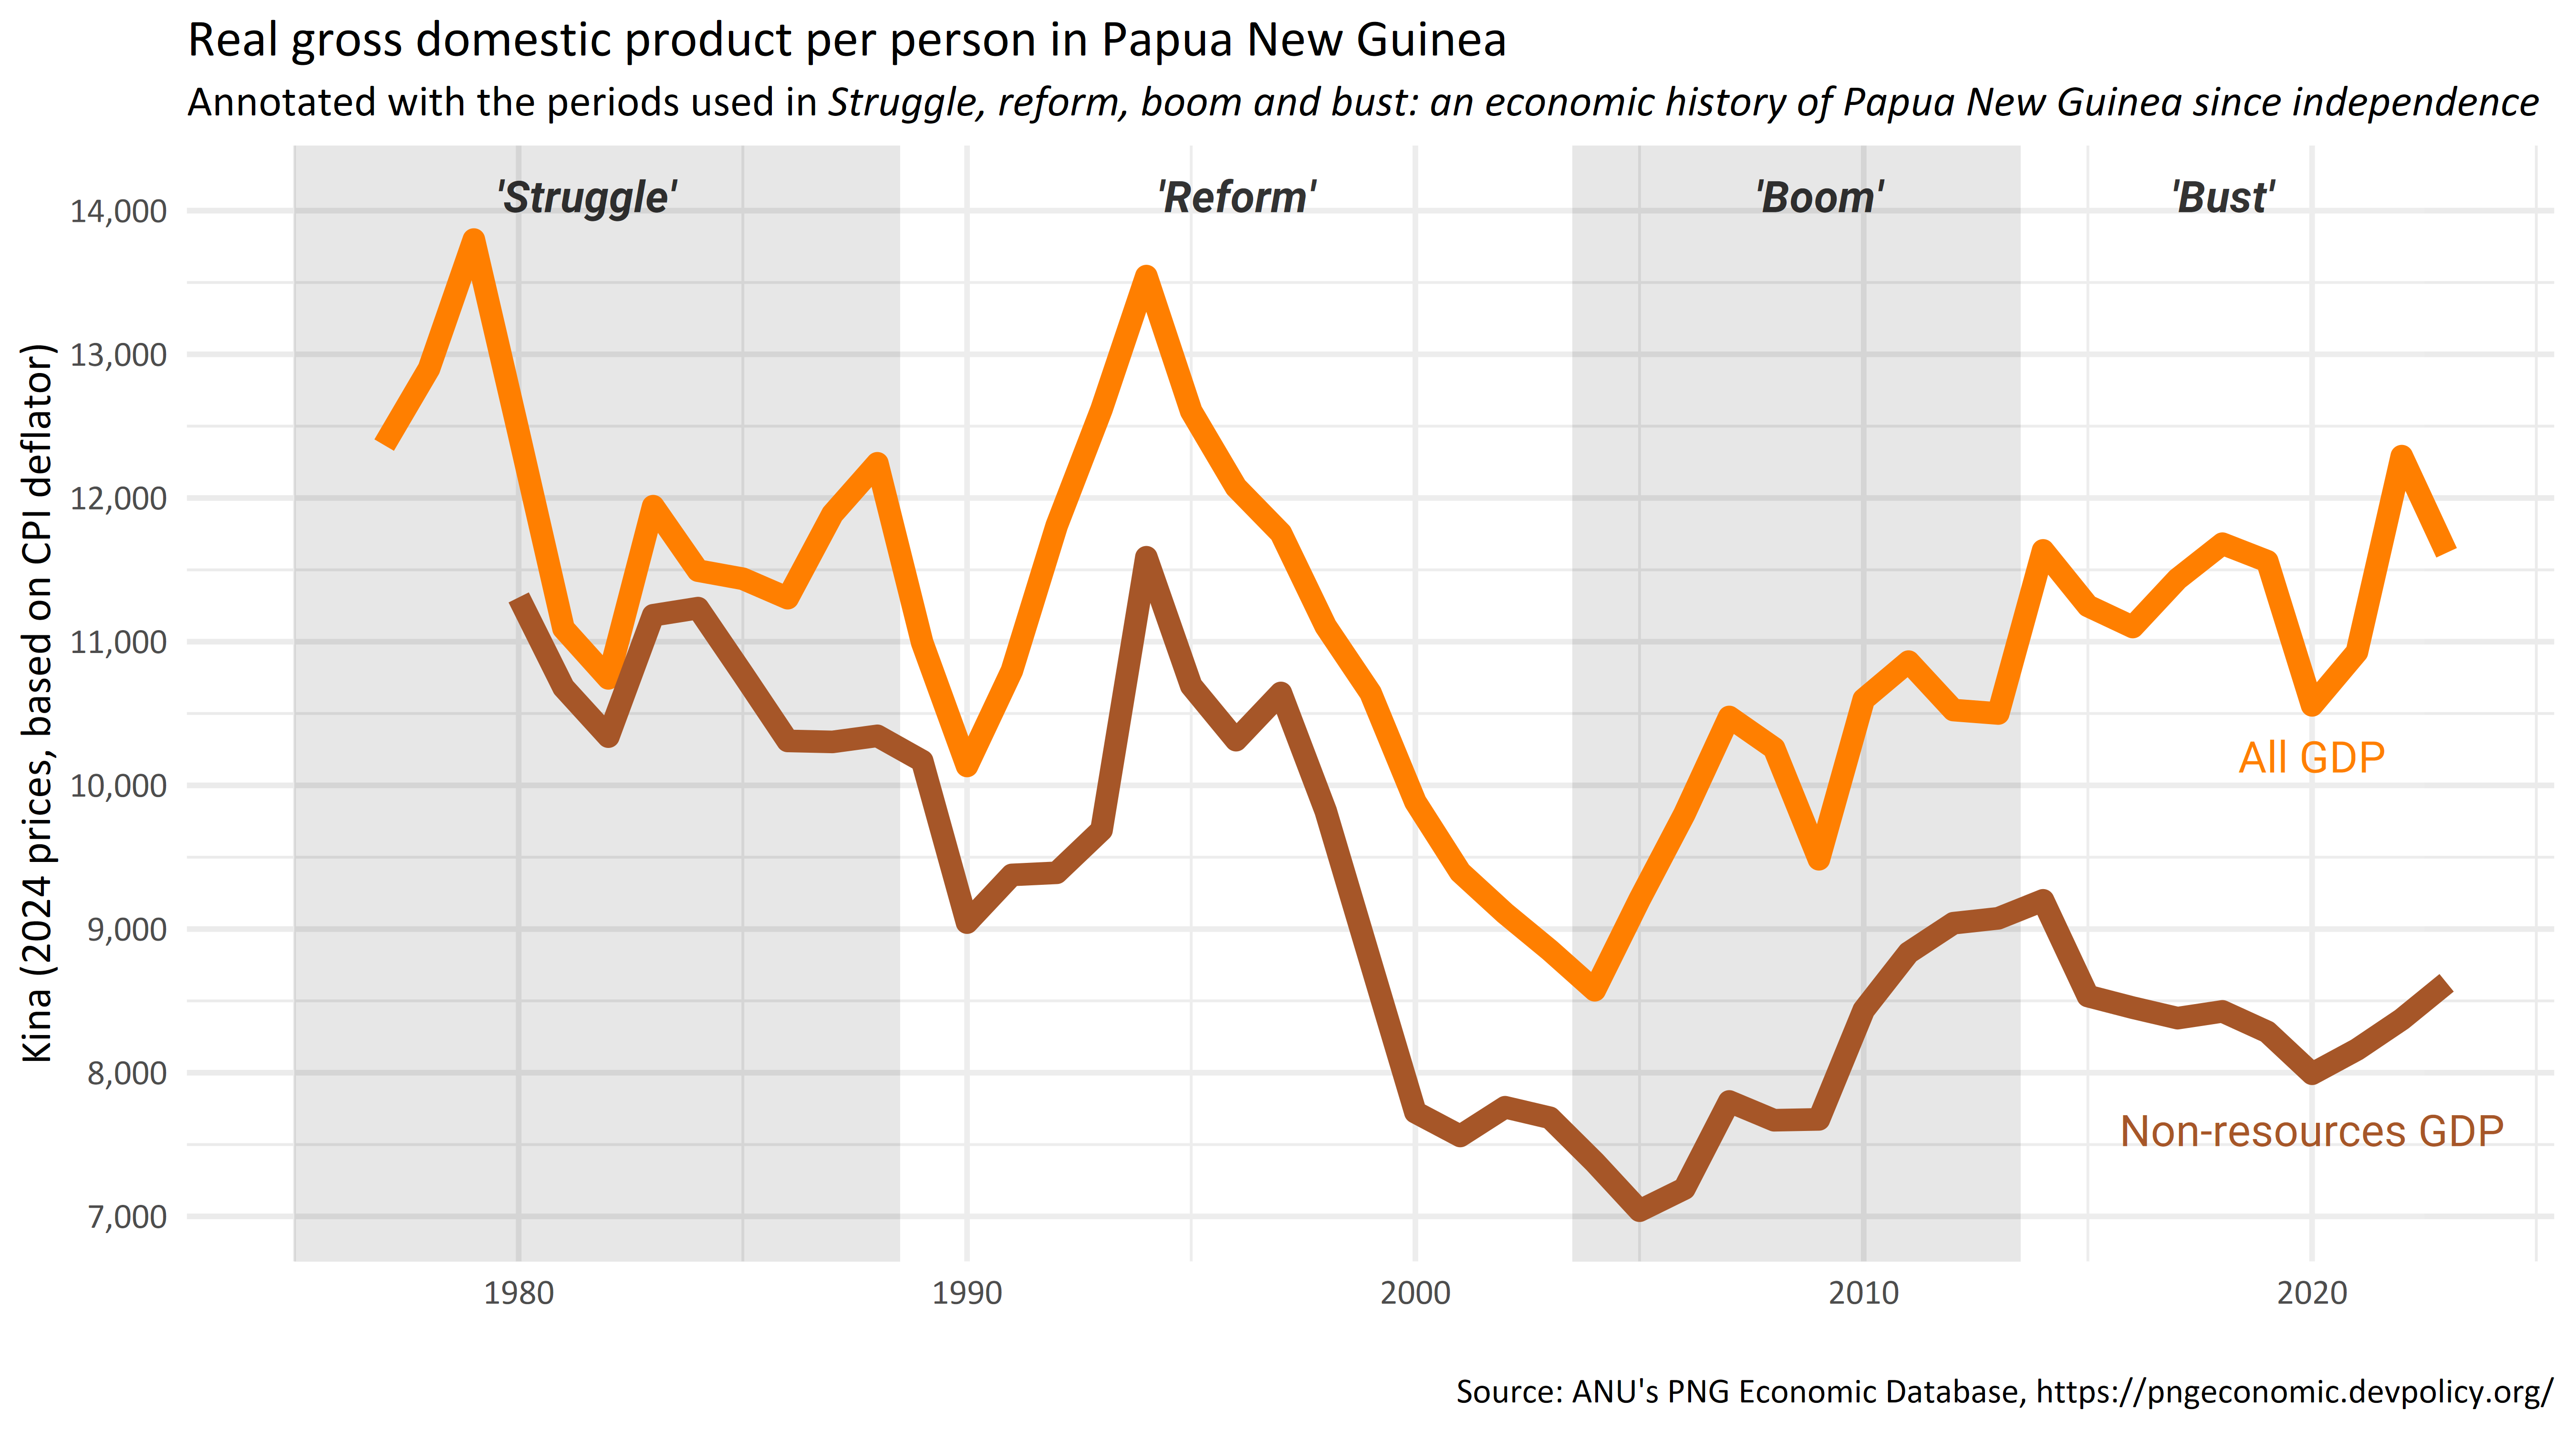
Some Papua New Guinea data doodles
07 September 2025
Motivated by an excellent recent book, I explore Papua New Guinea's statistics for GDP, population, employment and vaccination rates.
Animated population pyramids for the Pacific
17 May 2025
How to produce an animation of demographic patterns in Pacific island countries and territories from 1950 to 2050, in just a few lines of code.
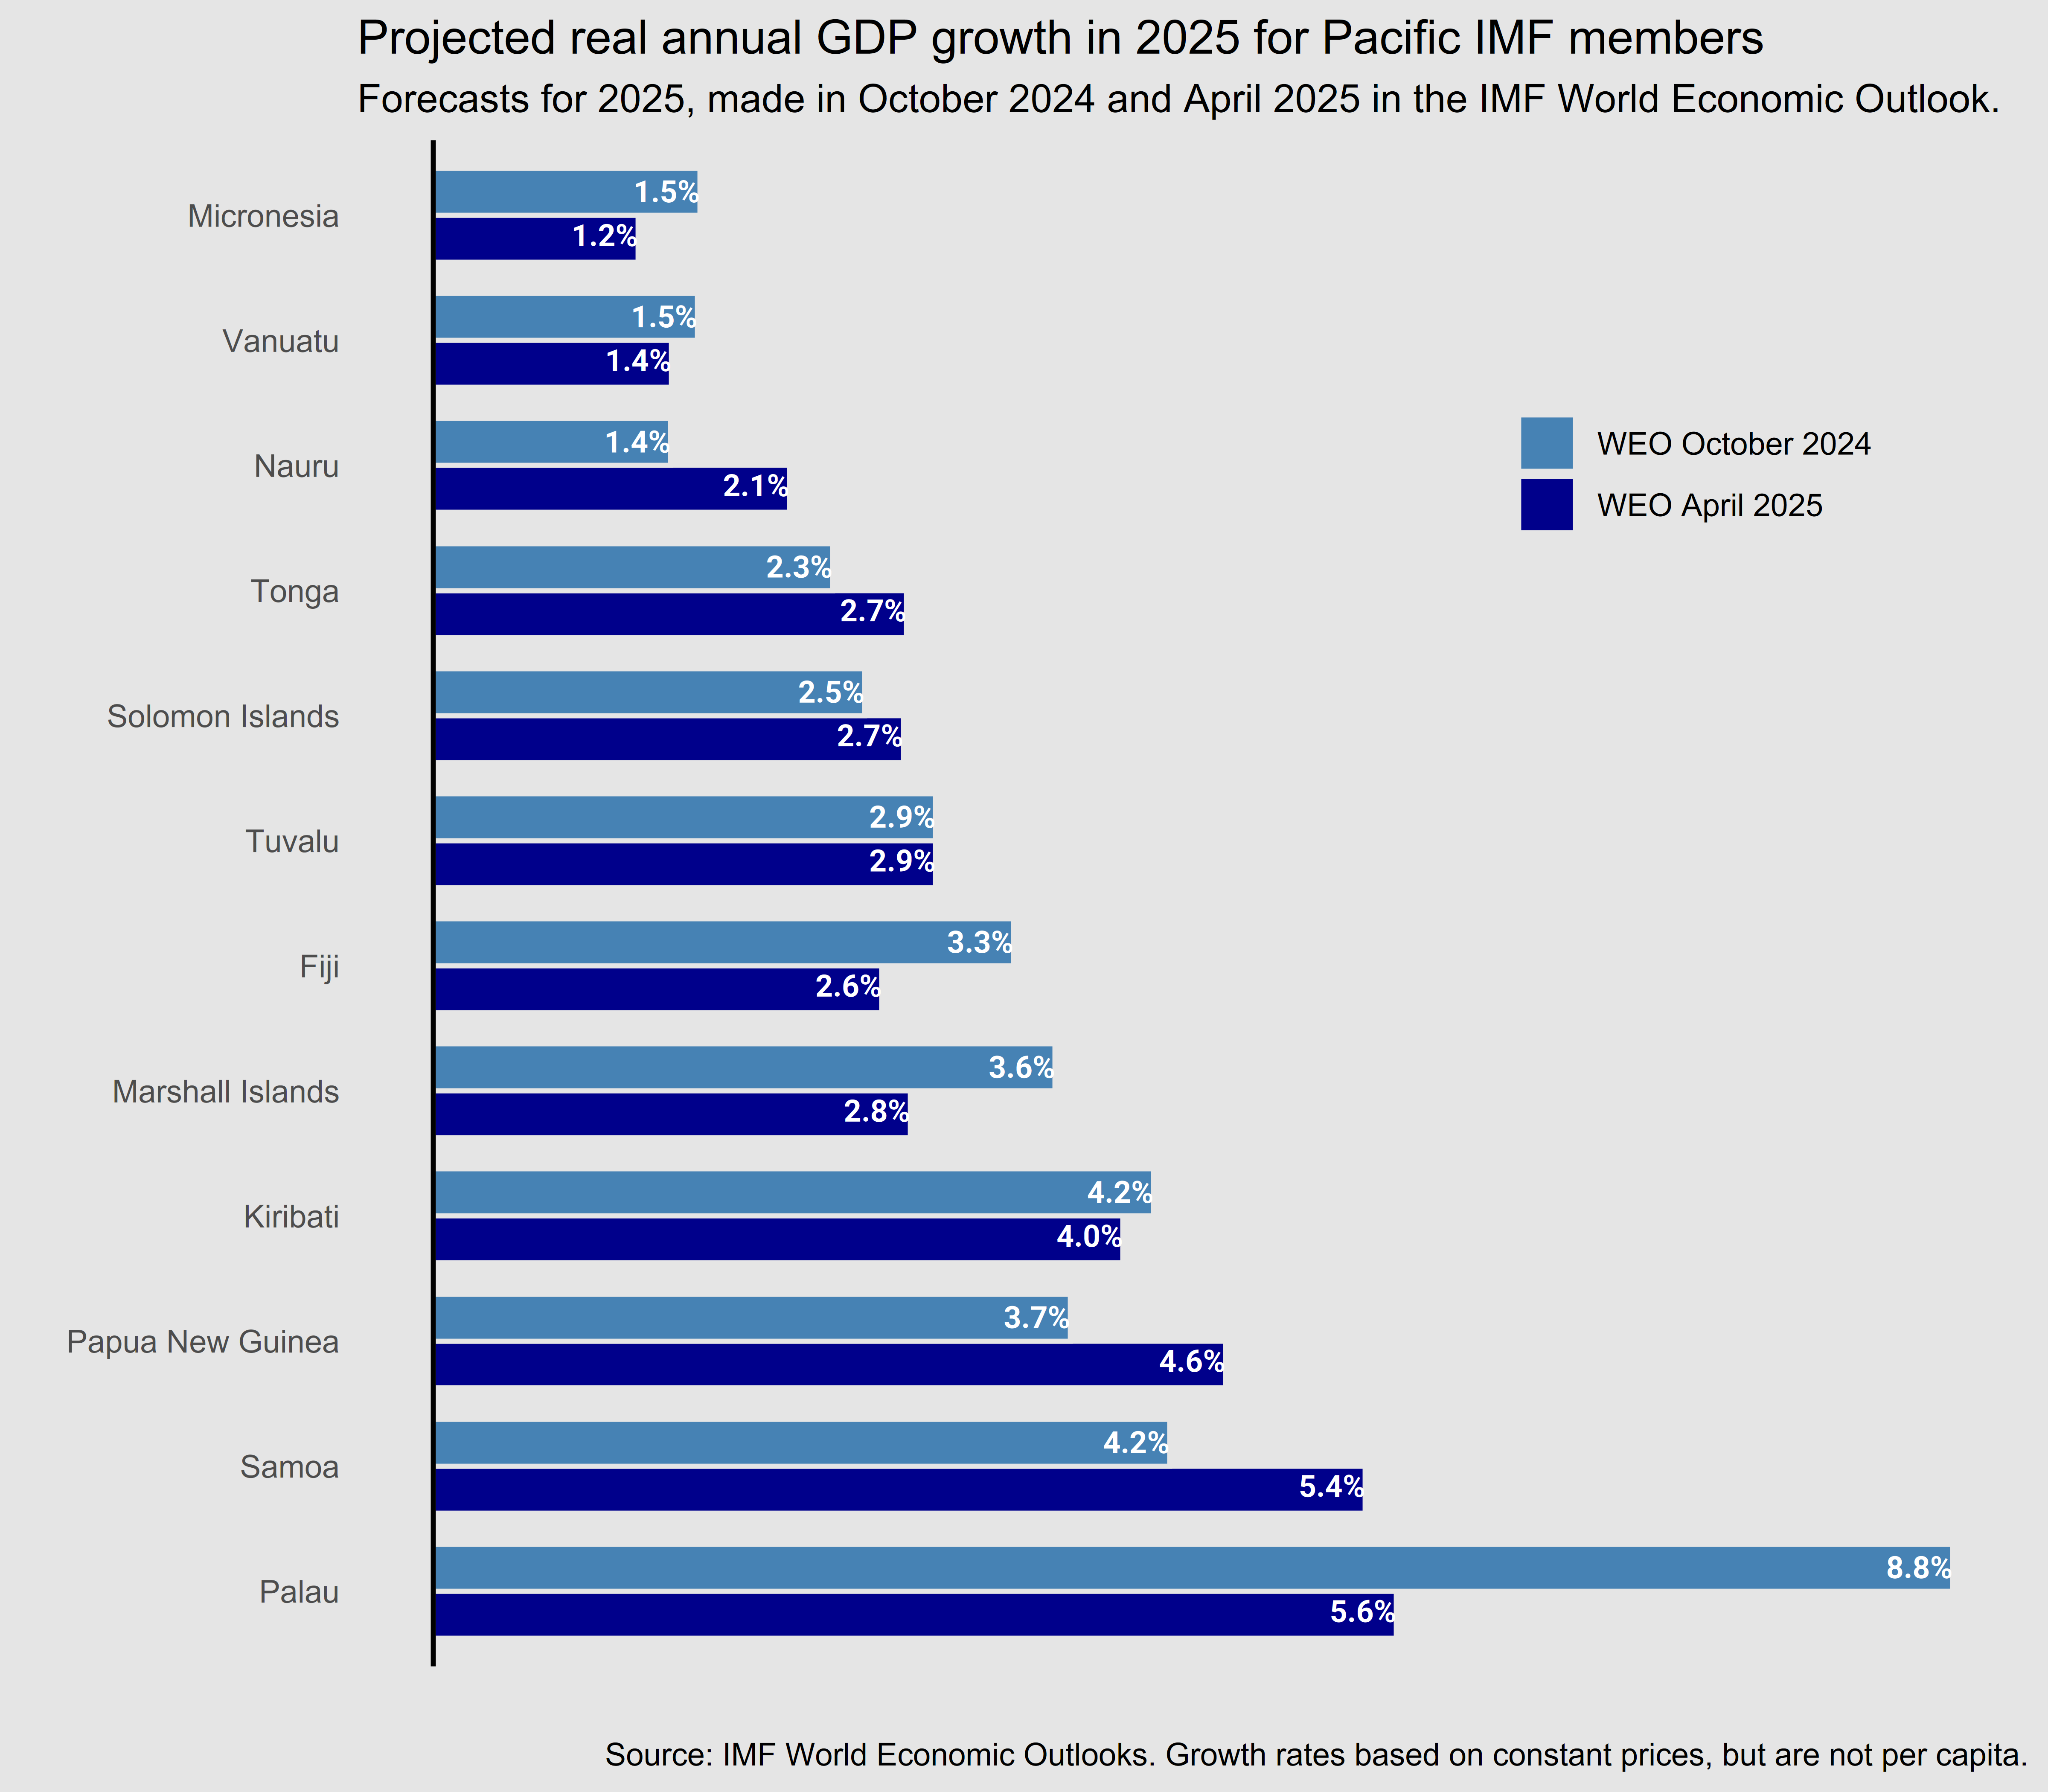
World Economic Outlook
26 April 2025
I have a quick look at the latest World Economic Outlook released by the IMF, with a particular eye on the economic growth forecasts for Pacific island countries. The Pacific countries that have had the biggest revision downwards in their growth prospects over the six months since the last Outlook are the three in the Compact of Free Association with USA (Palau, Marshall Islands, and Federated States of Micronesia), plus Fiji.
Simulating Ponzi schemes
30 November 2024
I write a function to simulate Ponzi schemes with various types of 'investor' growth, withdrawal rates, and extraction by the scammer / owner of the scheme.

Population age changes in the Pacific
27 July 2024
I polish up some visualisations of demographic trends in the Pacific.

Reproducing and adapting the UN Population Projections
05 May 2024
I have a mostly successful go at cohort component population projections to replicate the UN's totals from their published parts, with an idea to making small changes to observations or assumptions that can build on the official projections.

The 'V20' group of vulnerable countries and the MVI
17 October 2023
I compare the GDP per capita and scores on the UN Multidimensional Vulnerability Index (MVI) of the 68 economies in the 'V20' group with other countries that aren't part of the V20.

The UN's proposed Multidimensional Vulnerability Index
30 September 2023
I make some visualisations of the country scores of the UN's proposed Multidimensional Vulnerability Index

Simpler drawing of Pacific choropleth maps
17 June 2023
I demonstrate the function I use to make it simpler to draw choropleth maps based on Pacific Island countries' and territories' exclusive economic zones.

Covid-19 vaccination rates in the Pacific
28 May 2023
I compare vaccination rates in the Pacific to GDP per capita and find the evidence isn't strong enough to say that there is a relationship between the two.

Showing women proportion of Parliamentarians on a map
26 May 2023
I have a go at showing the proportion of members of Parliament that are women on a map of the world, as an experiment in a tricky data visualisation

Pacific island choropleth map
13 October 2022
Drawing an annotated choropleth map of Pacific Island countries and territories.

Pacific island population pyramids
14 August 2022
I show how to access data from the Pacific Data Hub to draw population pyramids of Pacific Island countries and territories.
