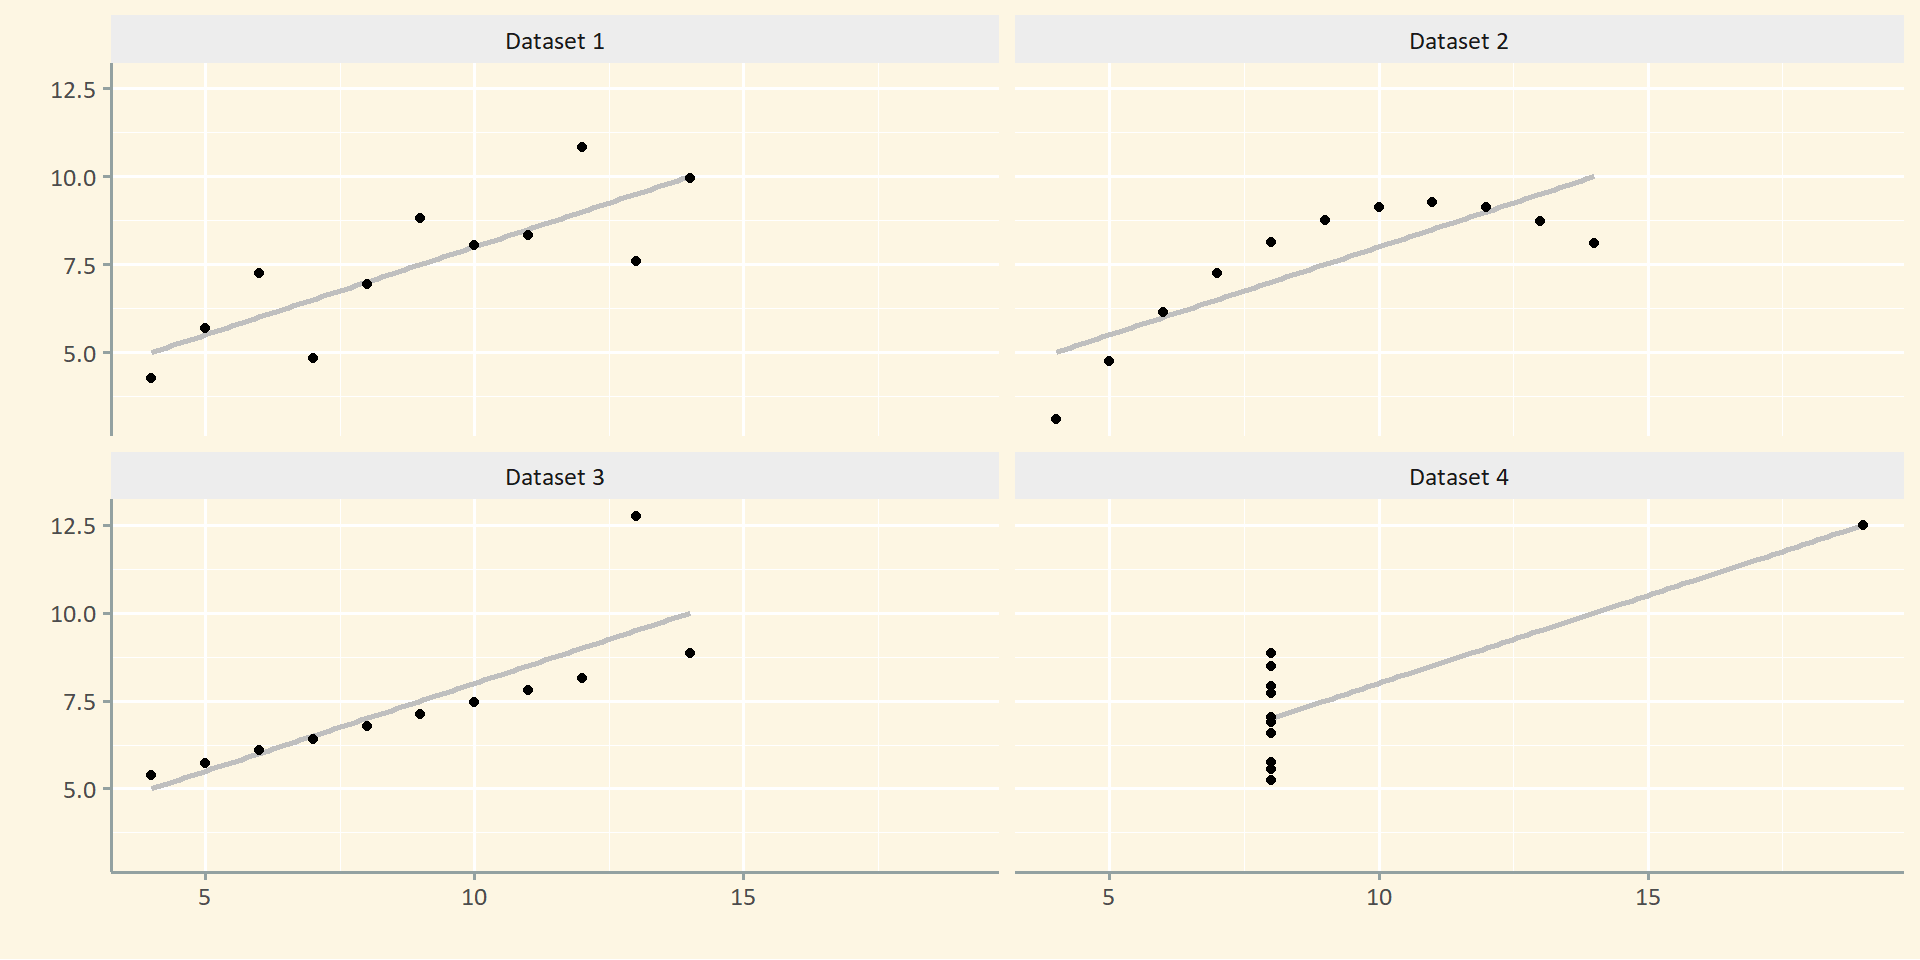
   x1    y1 x2   y2 x3    y3 x4    y4
1  10  8.04 10 9.14 10  7.46  8  6.58
2   8  6.95  8 8.14  8  6.77  8  5.76
3  13  7.58 13 8.74 13 12.74  8  7.71
4   9  8.81  9 8.77  9  7.11  8  8.84
5  11  8.33 11 9.26 11  7.81  8  8.47
6  14  9.96 14 8.10 14  8.84  8  7.04
7   6  7.24  6 6.13  6  6.08  8  5.25
8   4  4.26  4 3.10  4  5.39 19 12.50
9  12 10.84 12 9.13 12  8.15  8  5.56
10  7  4.82  7 7.26  7  6.42  8  7.91
11 5 5.68 5 4.74 5 5.73 8 6.89Statistical graphics for communicating
July 2023
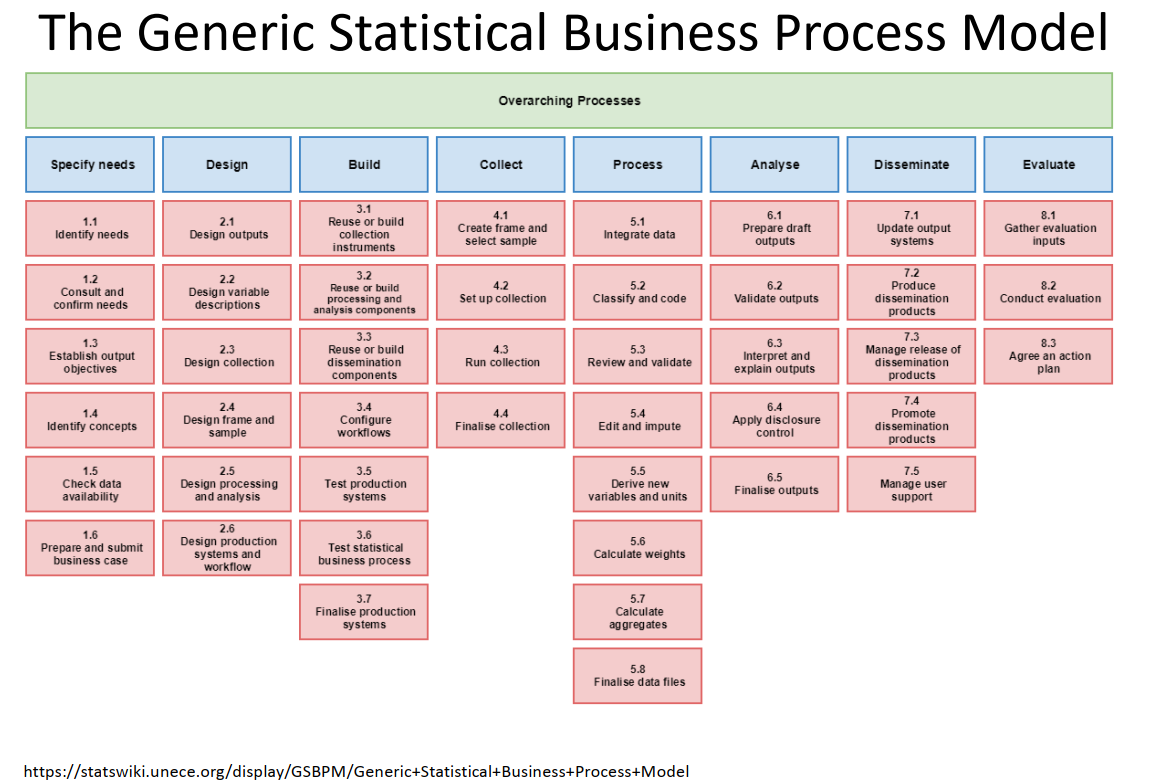
Different parts of the workflow
Compared to this:
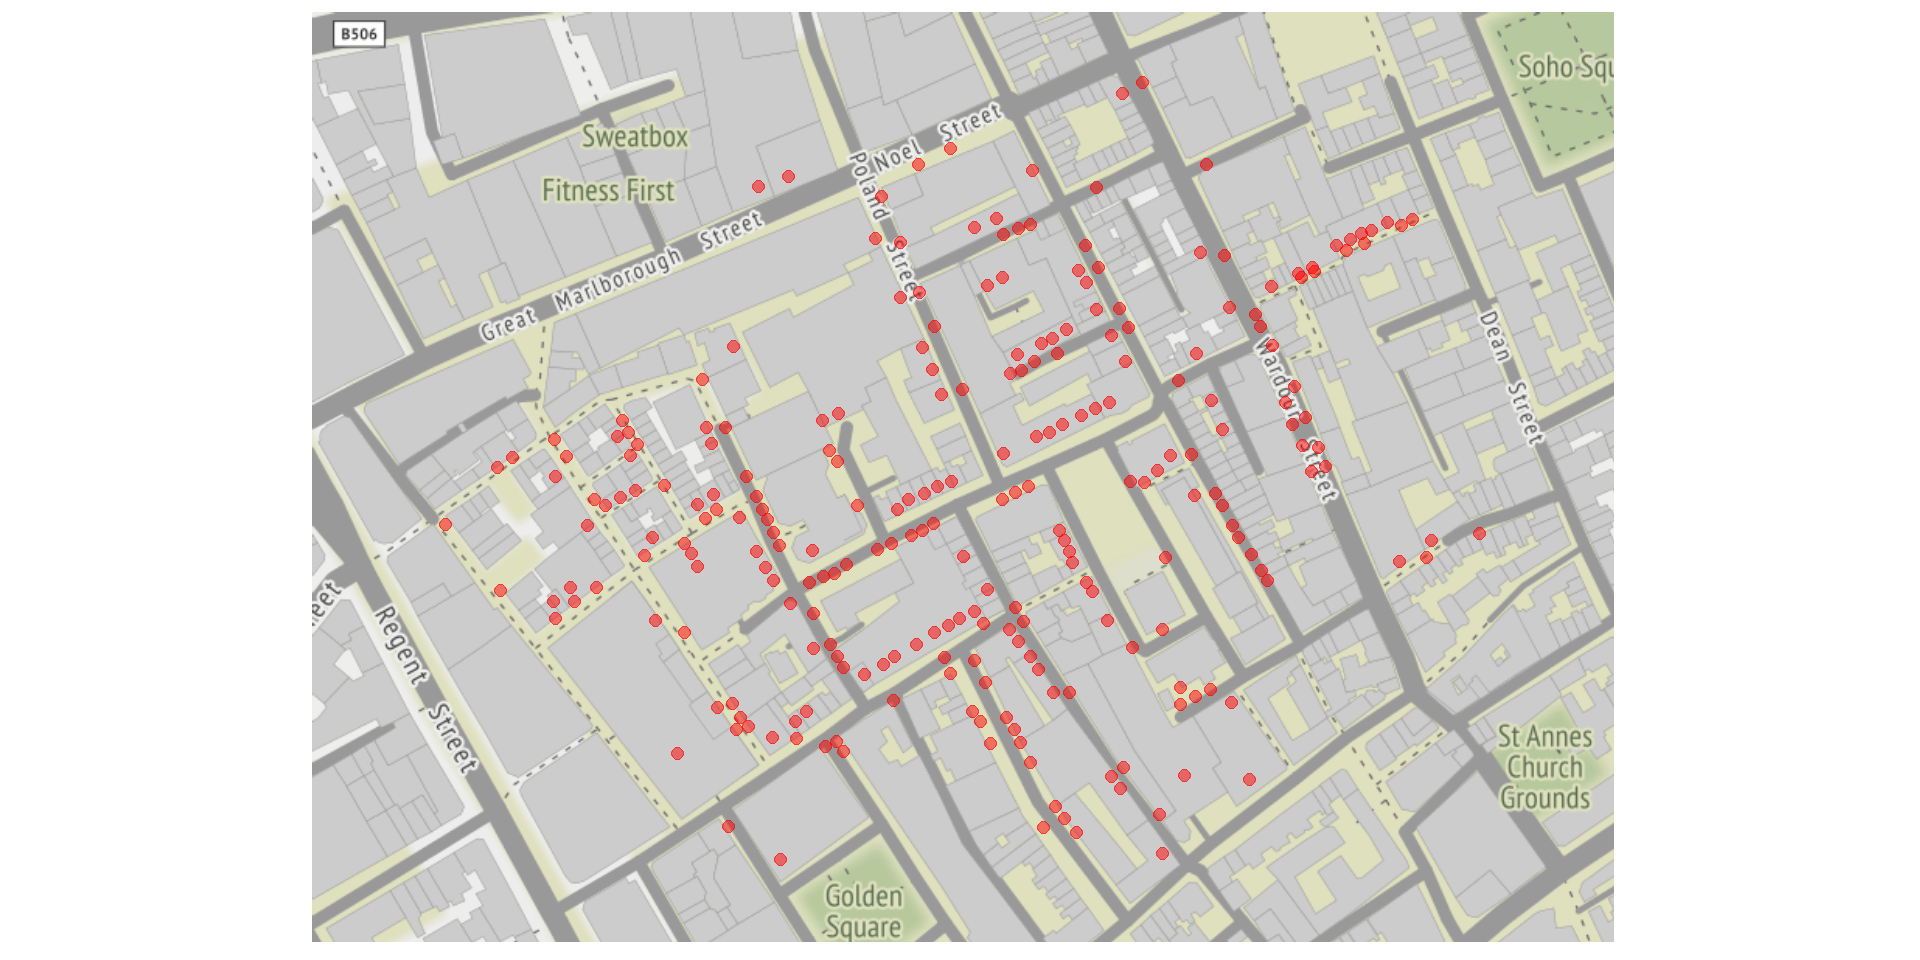
Put the data in its place
Use during analysis
Or to present results
Illustrate concepts
Simplify results
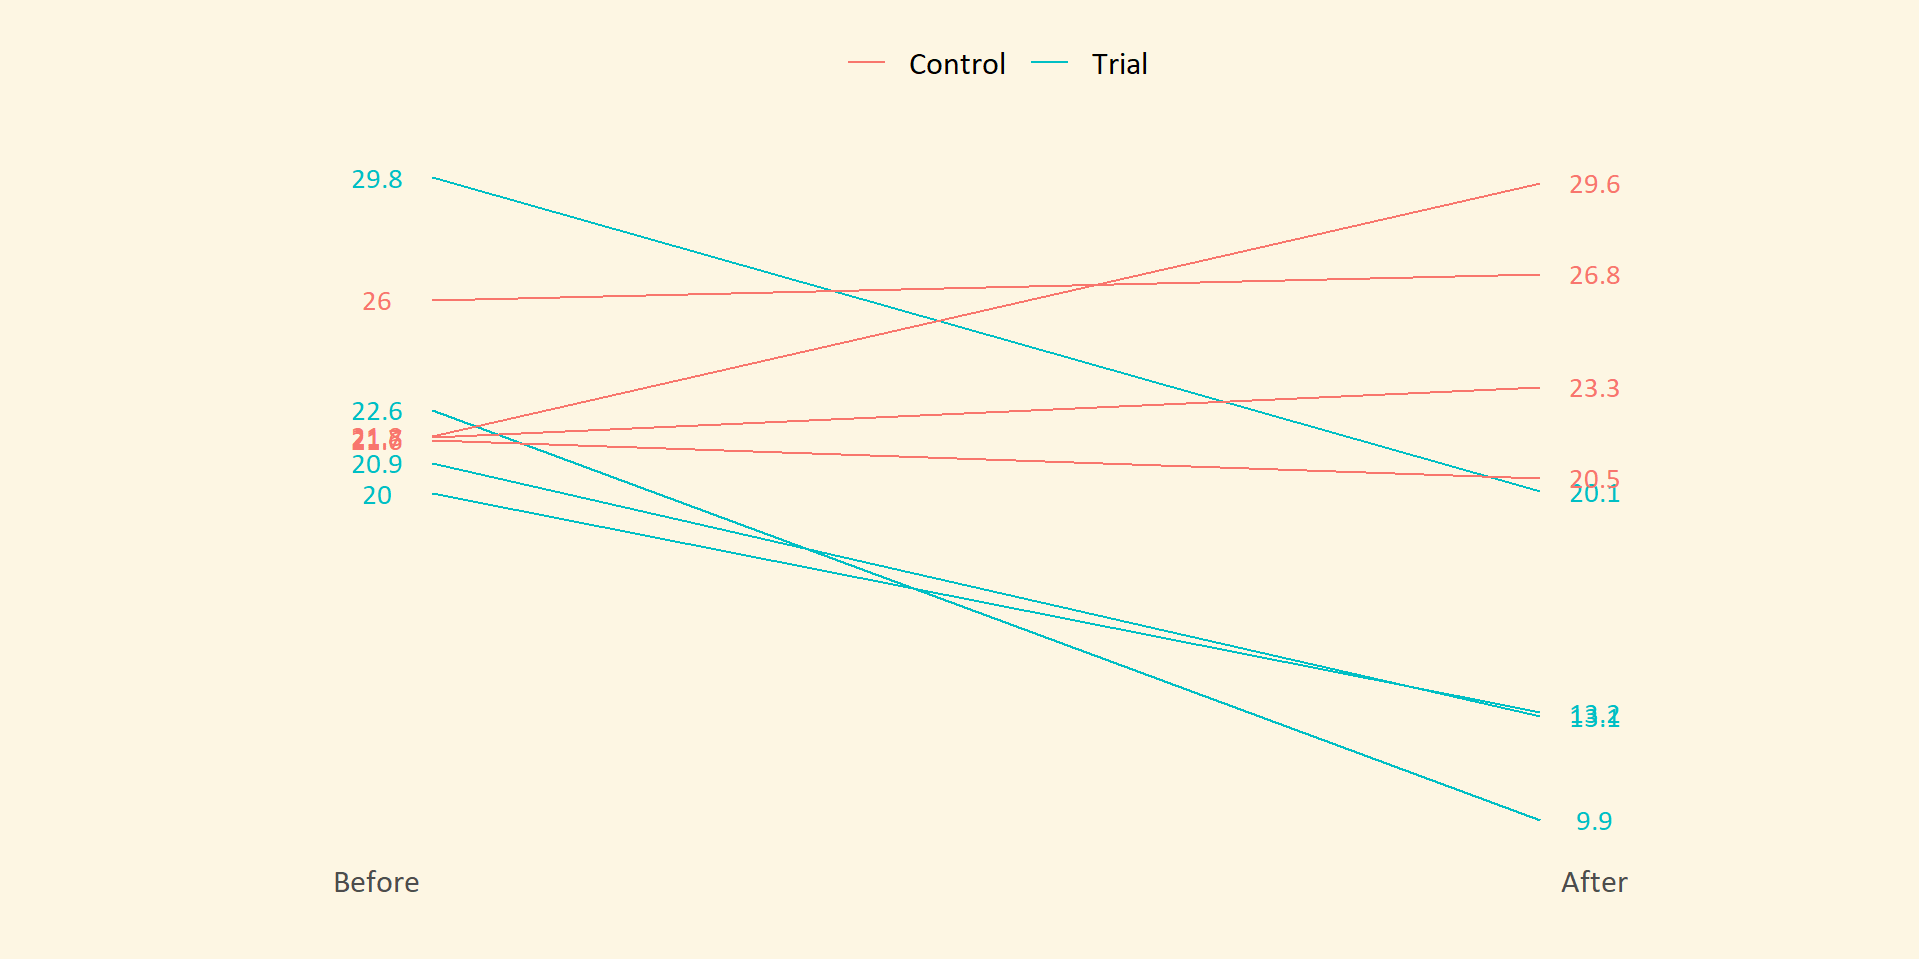
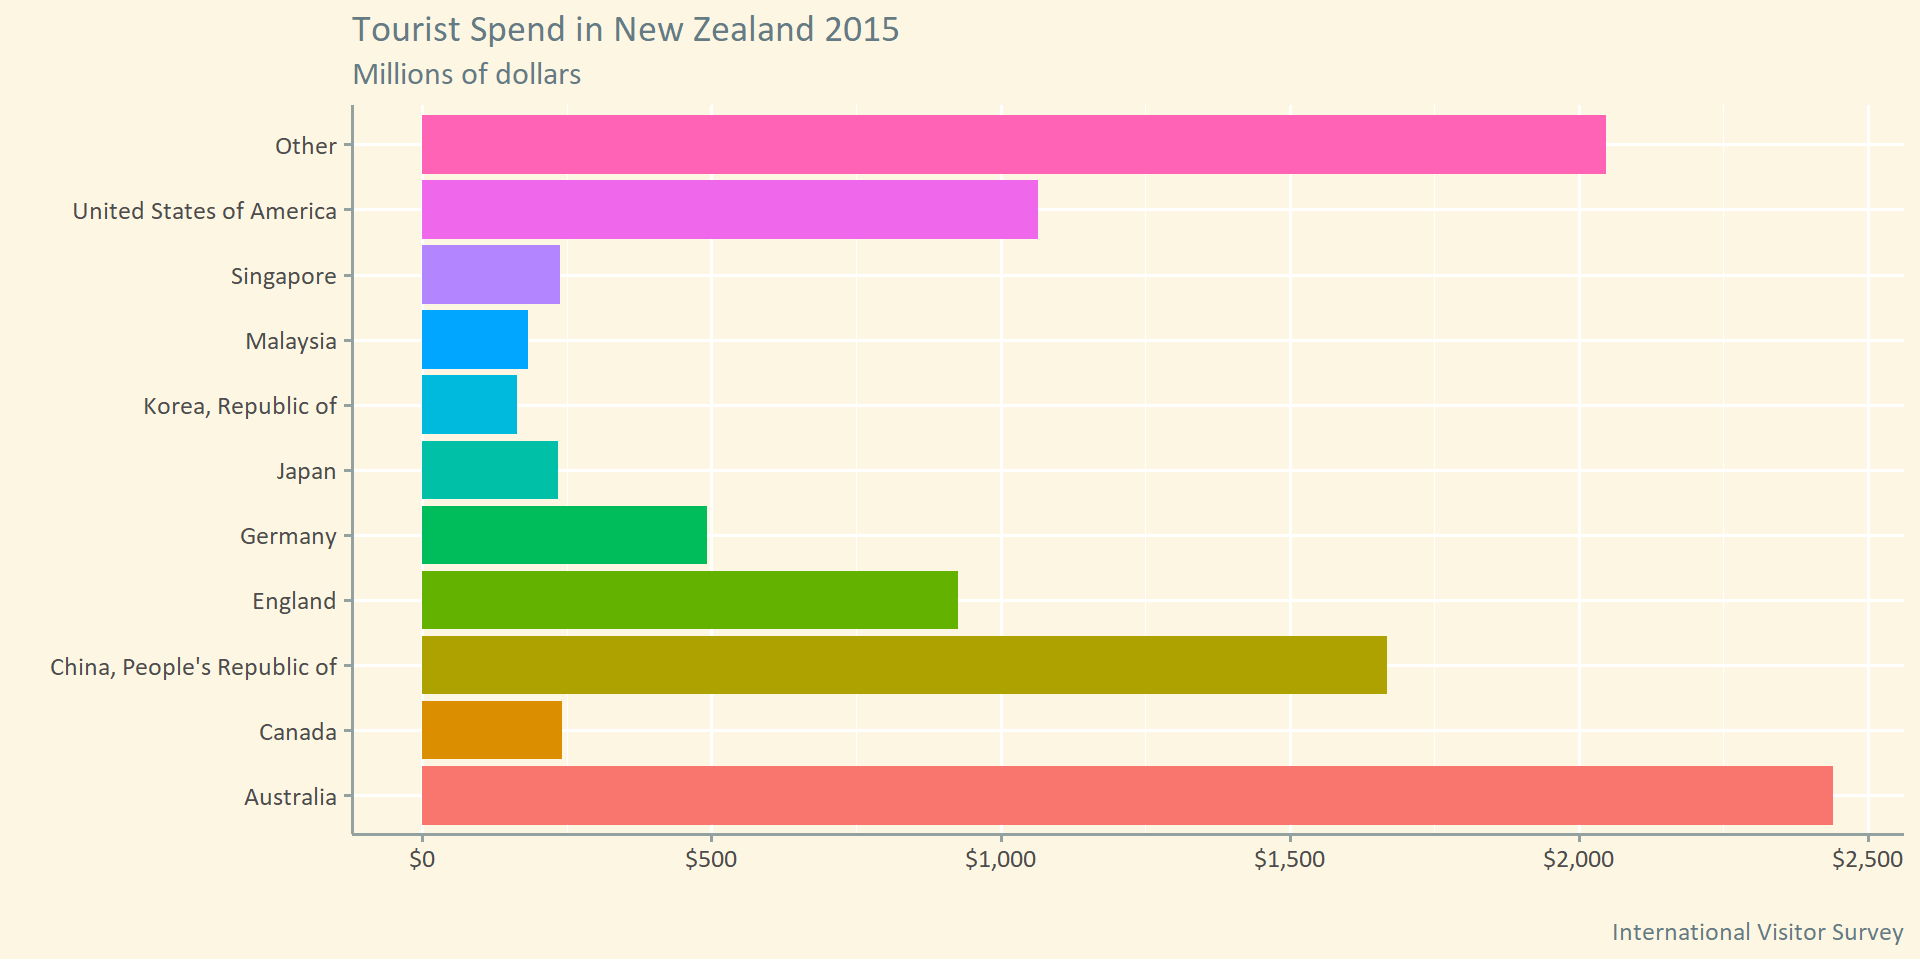
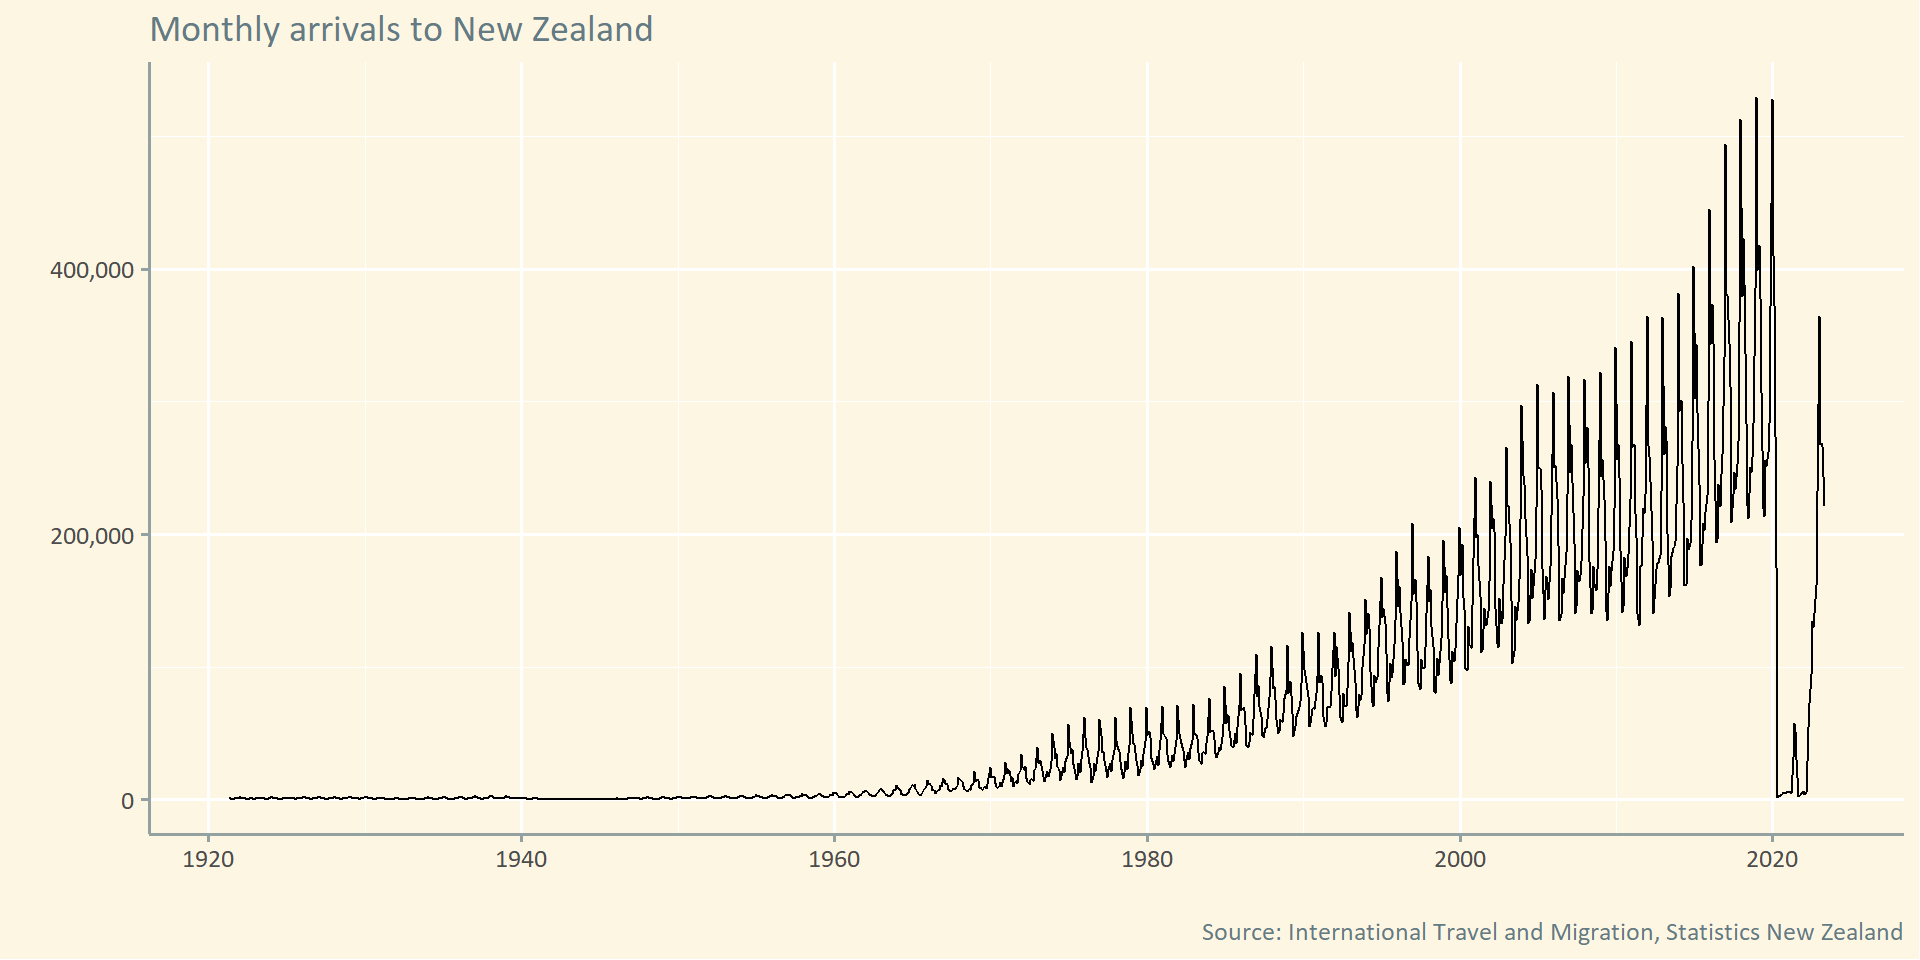
Change this…
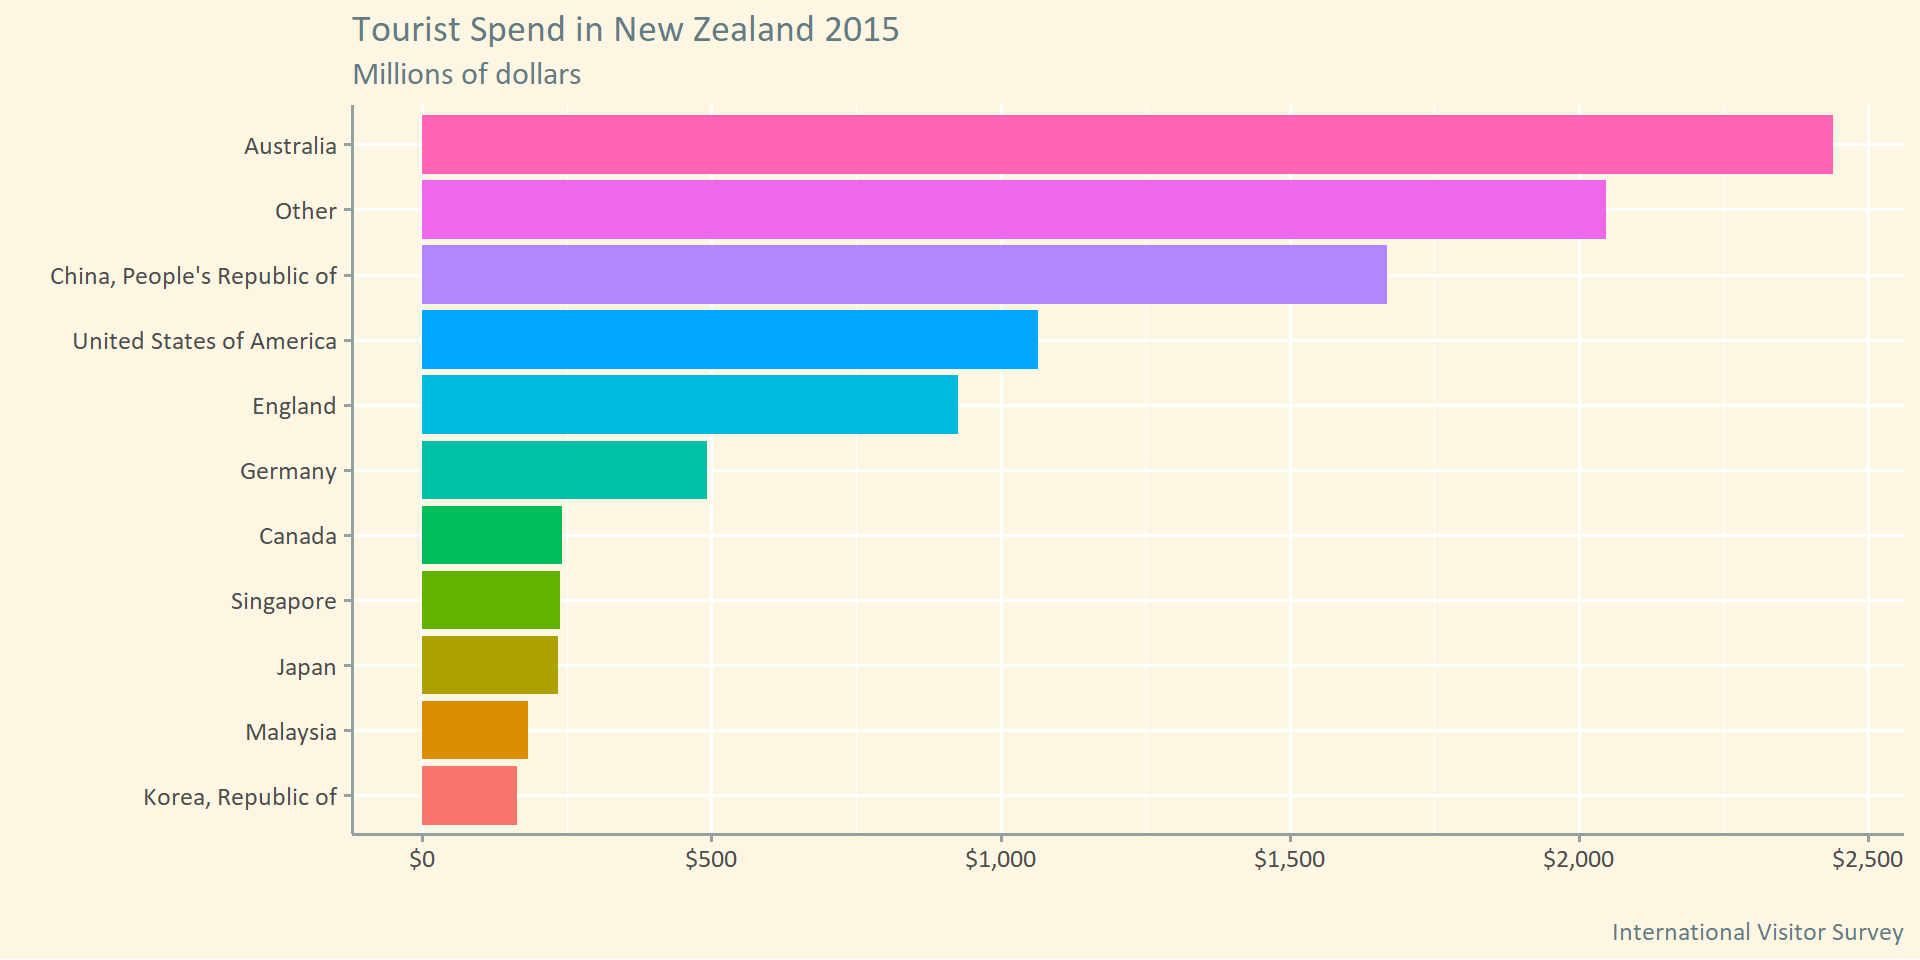
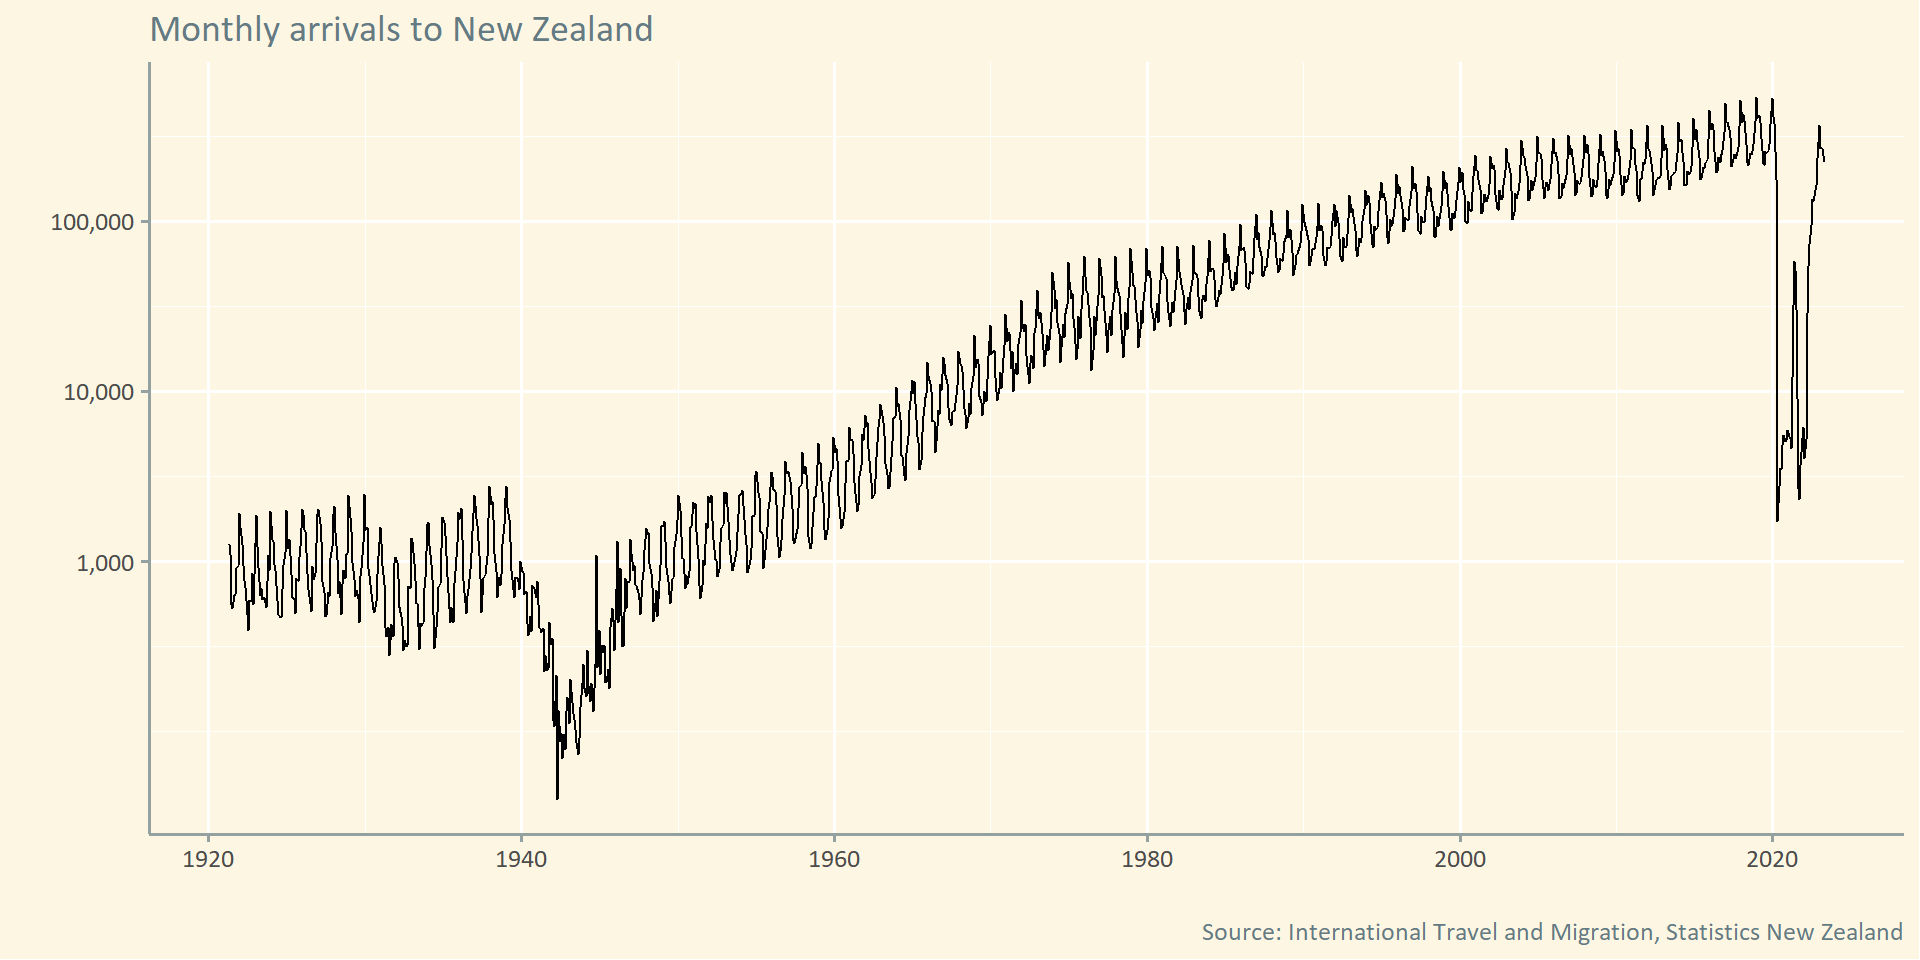
…to this:
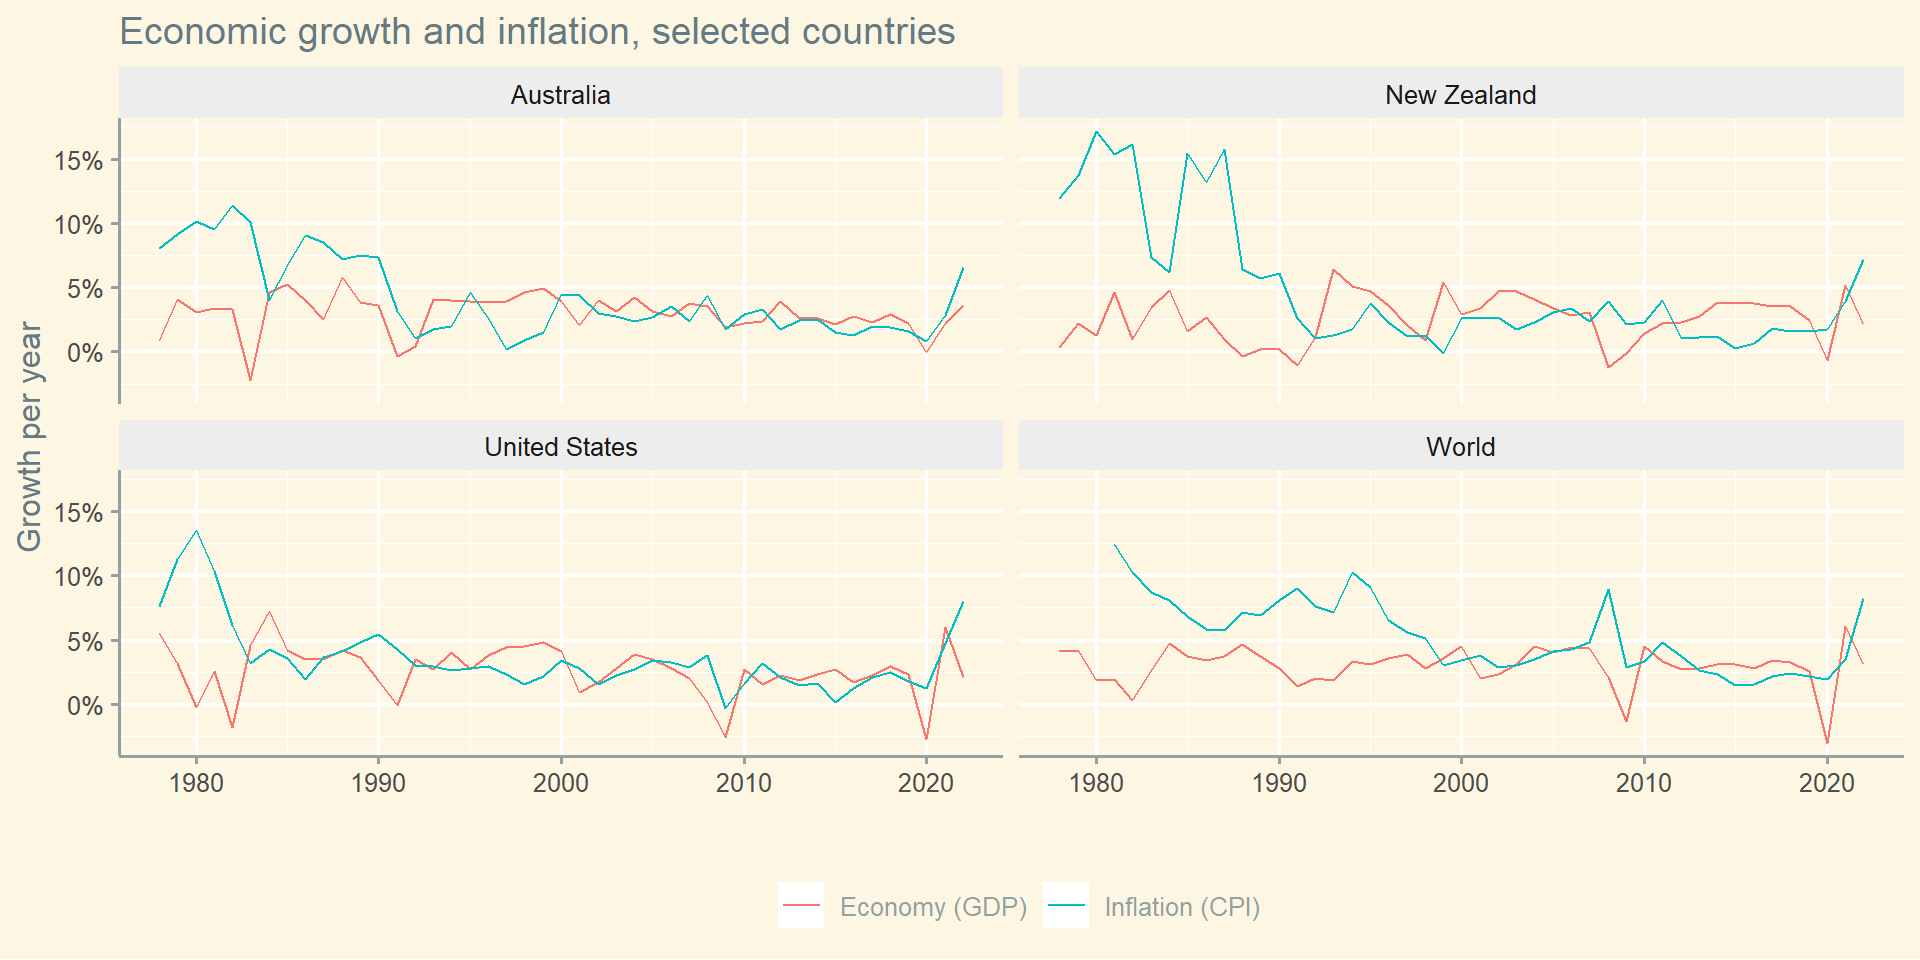
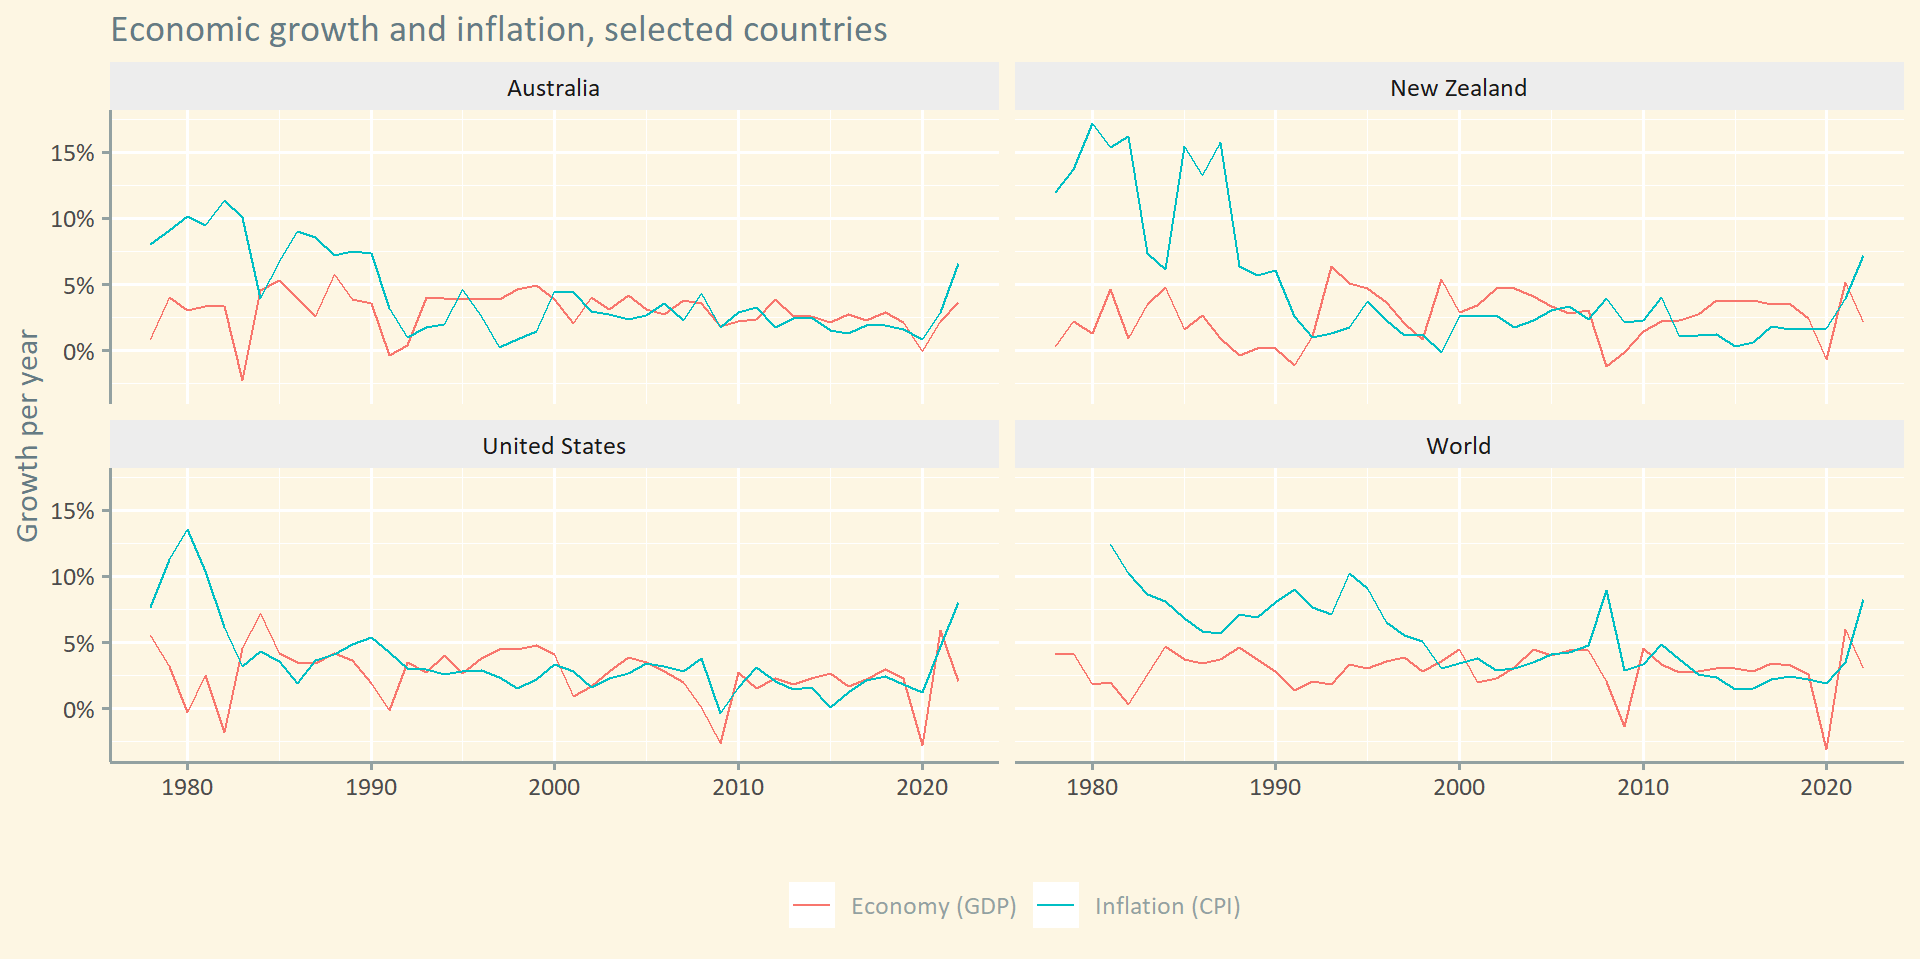
This is good
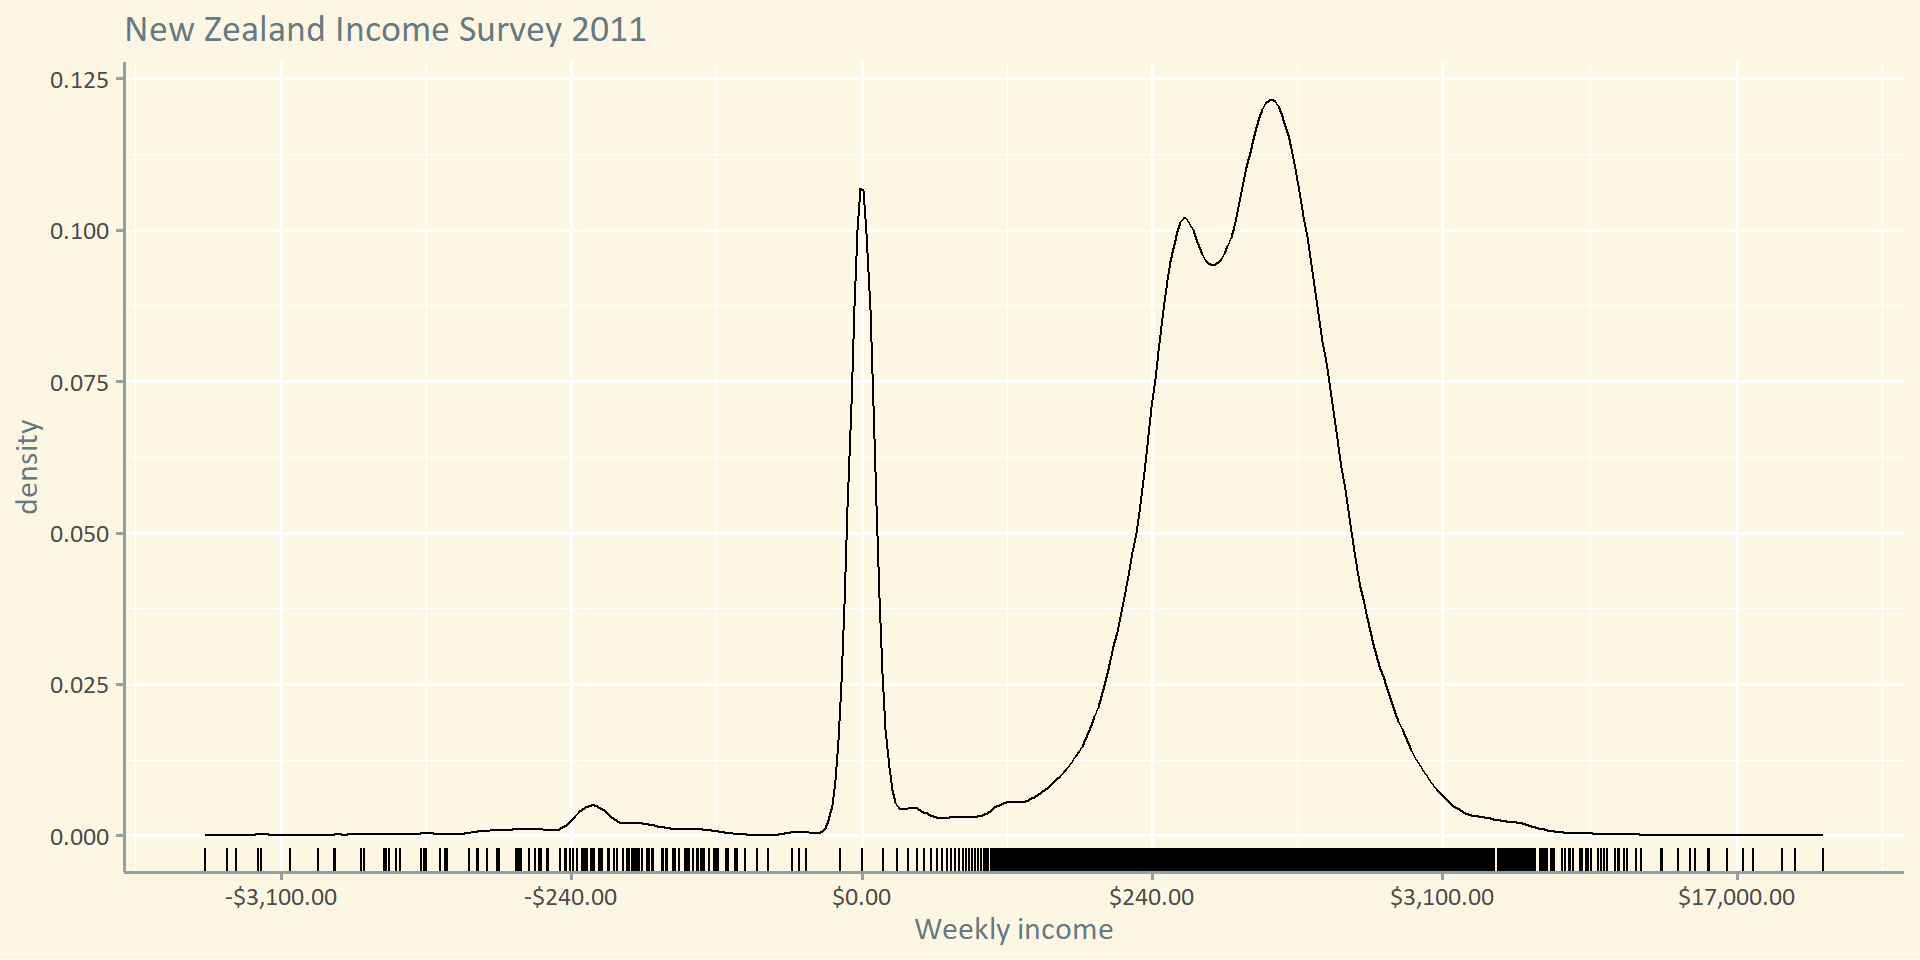
But this might be better
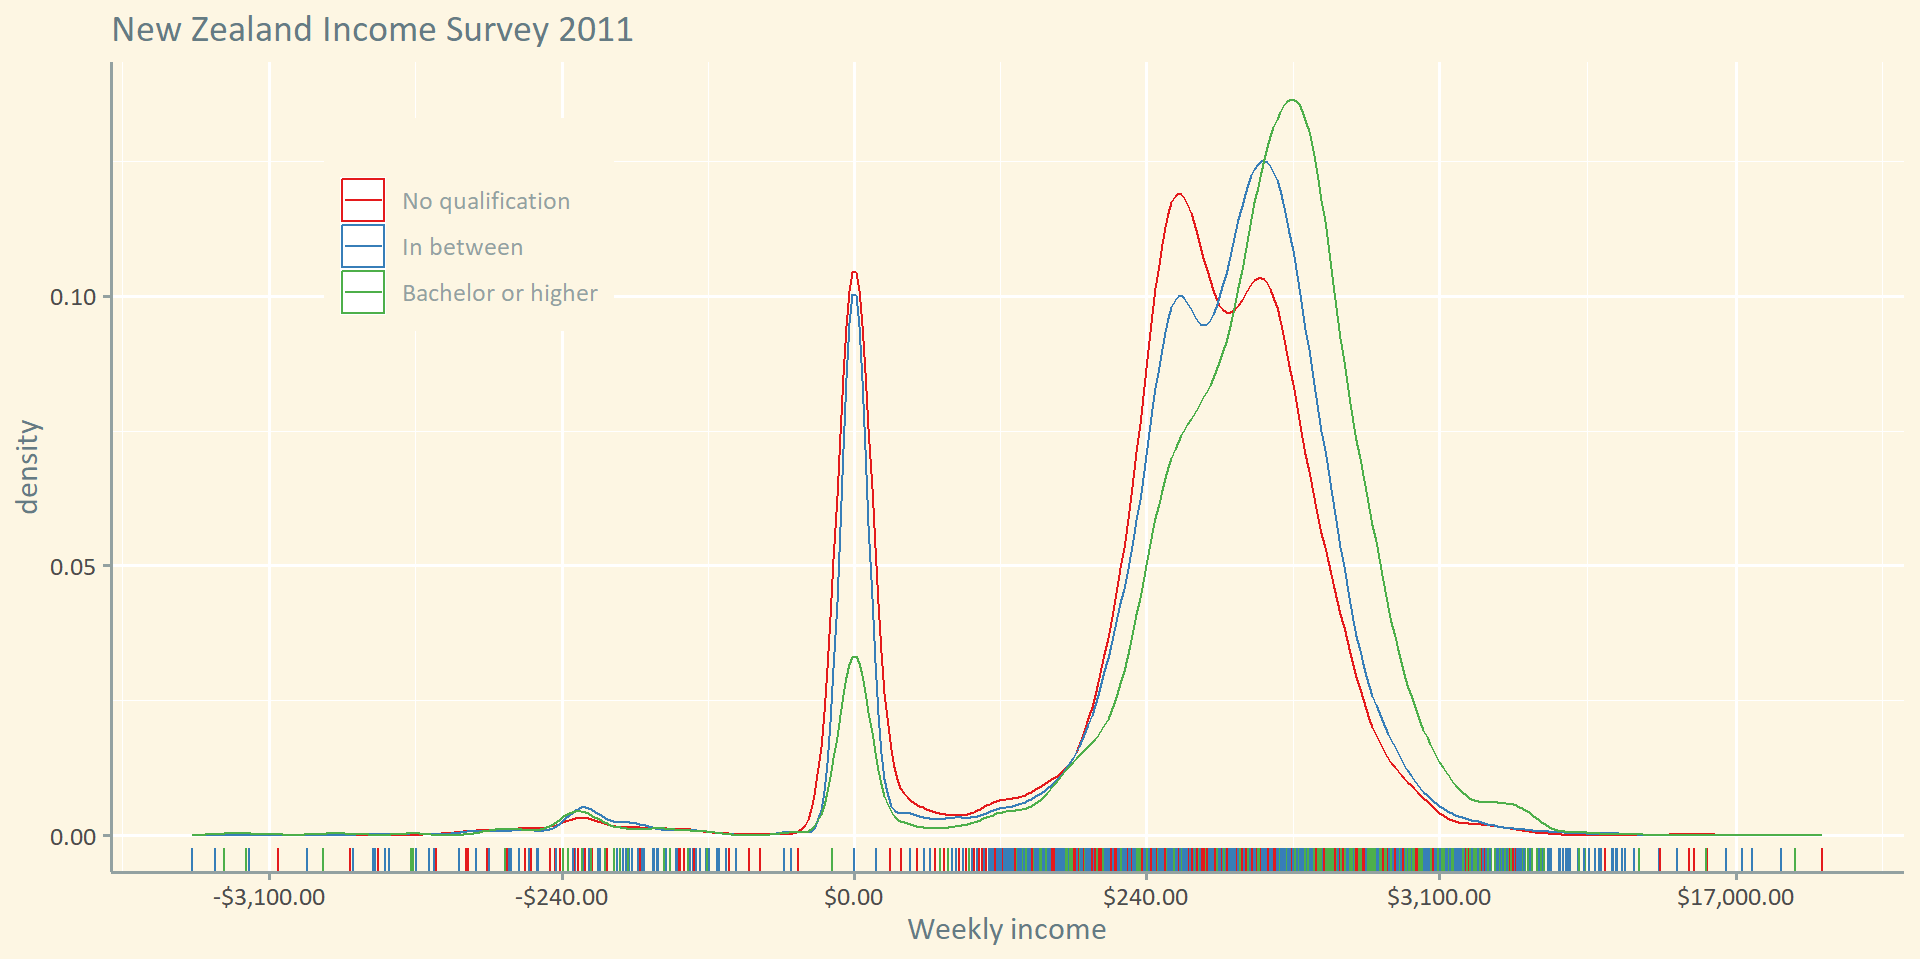
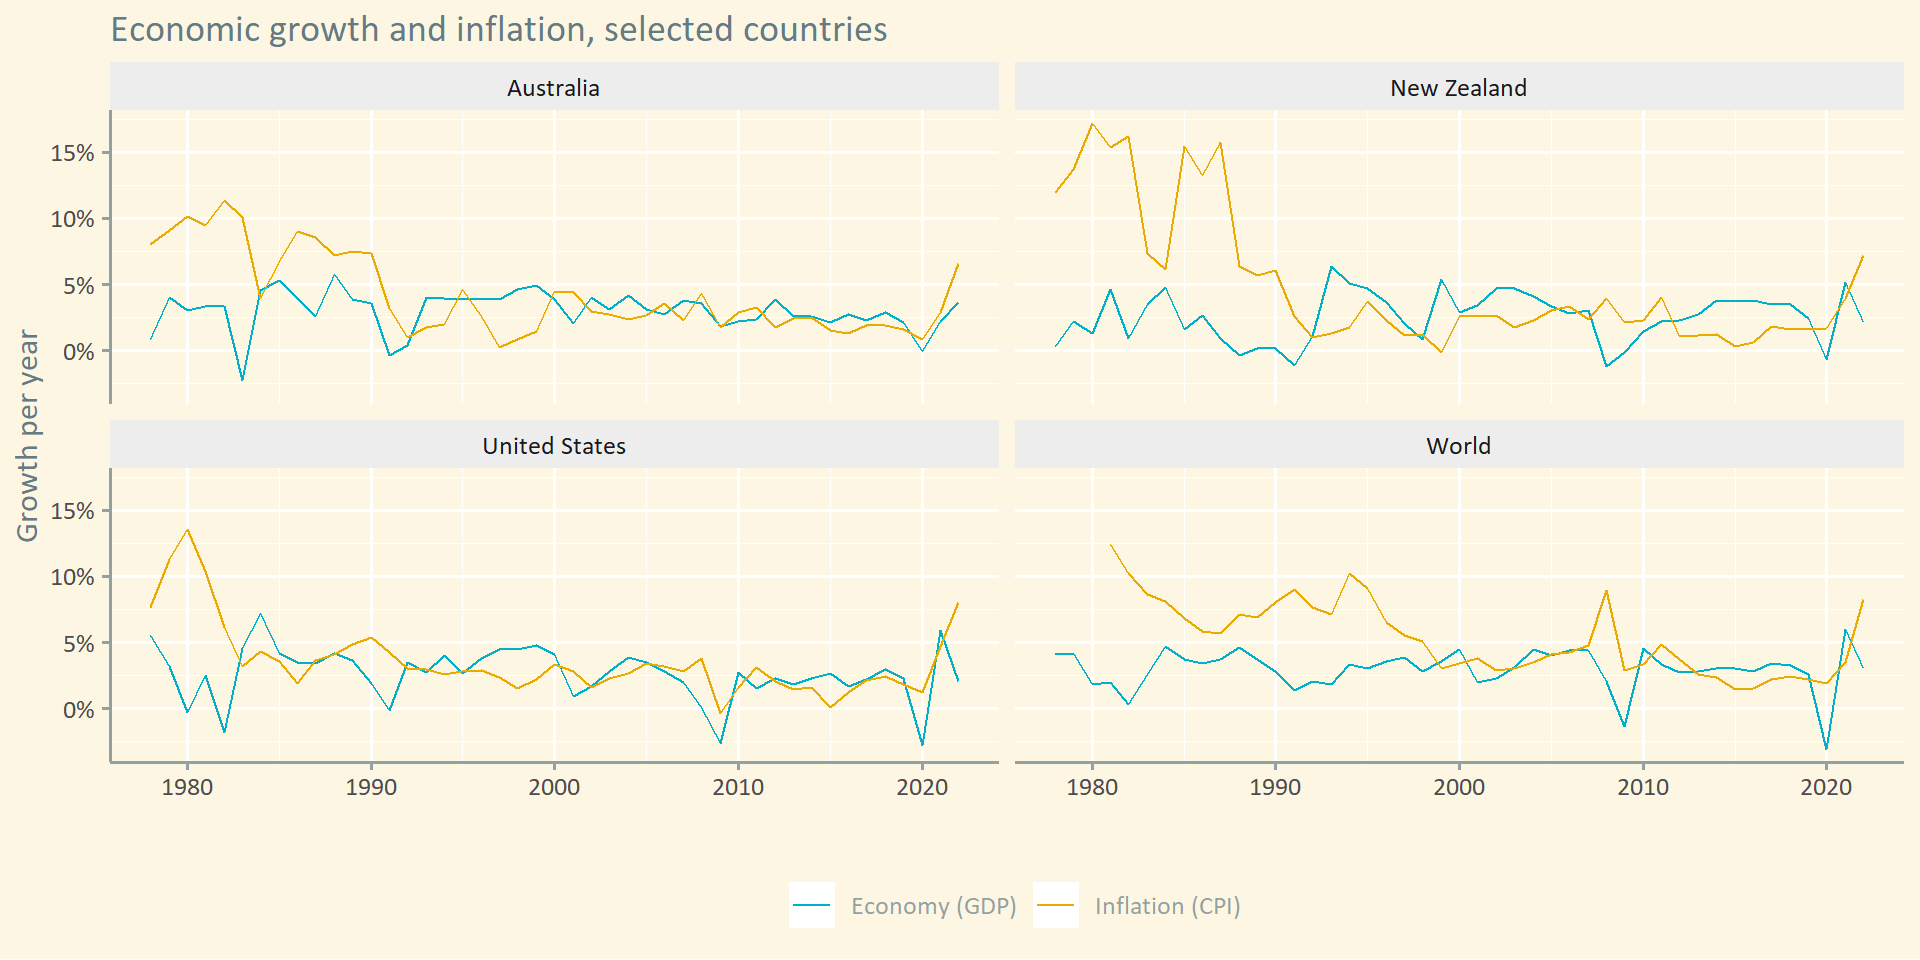
This is good
But this might be better
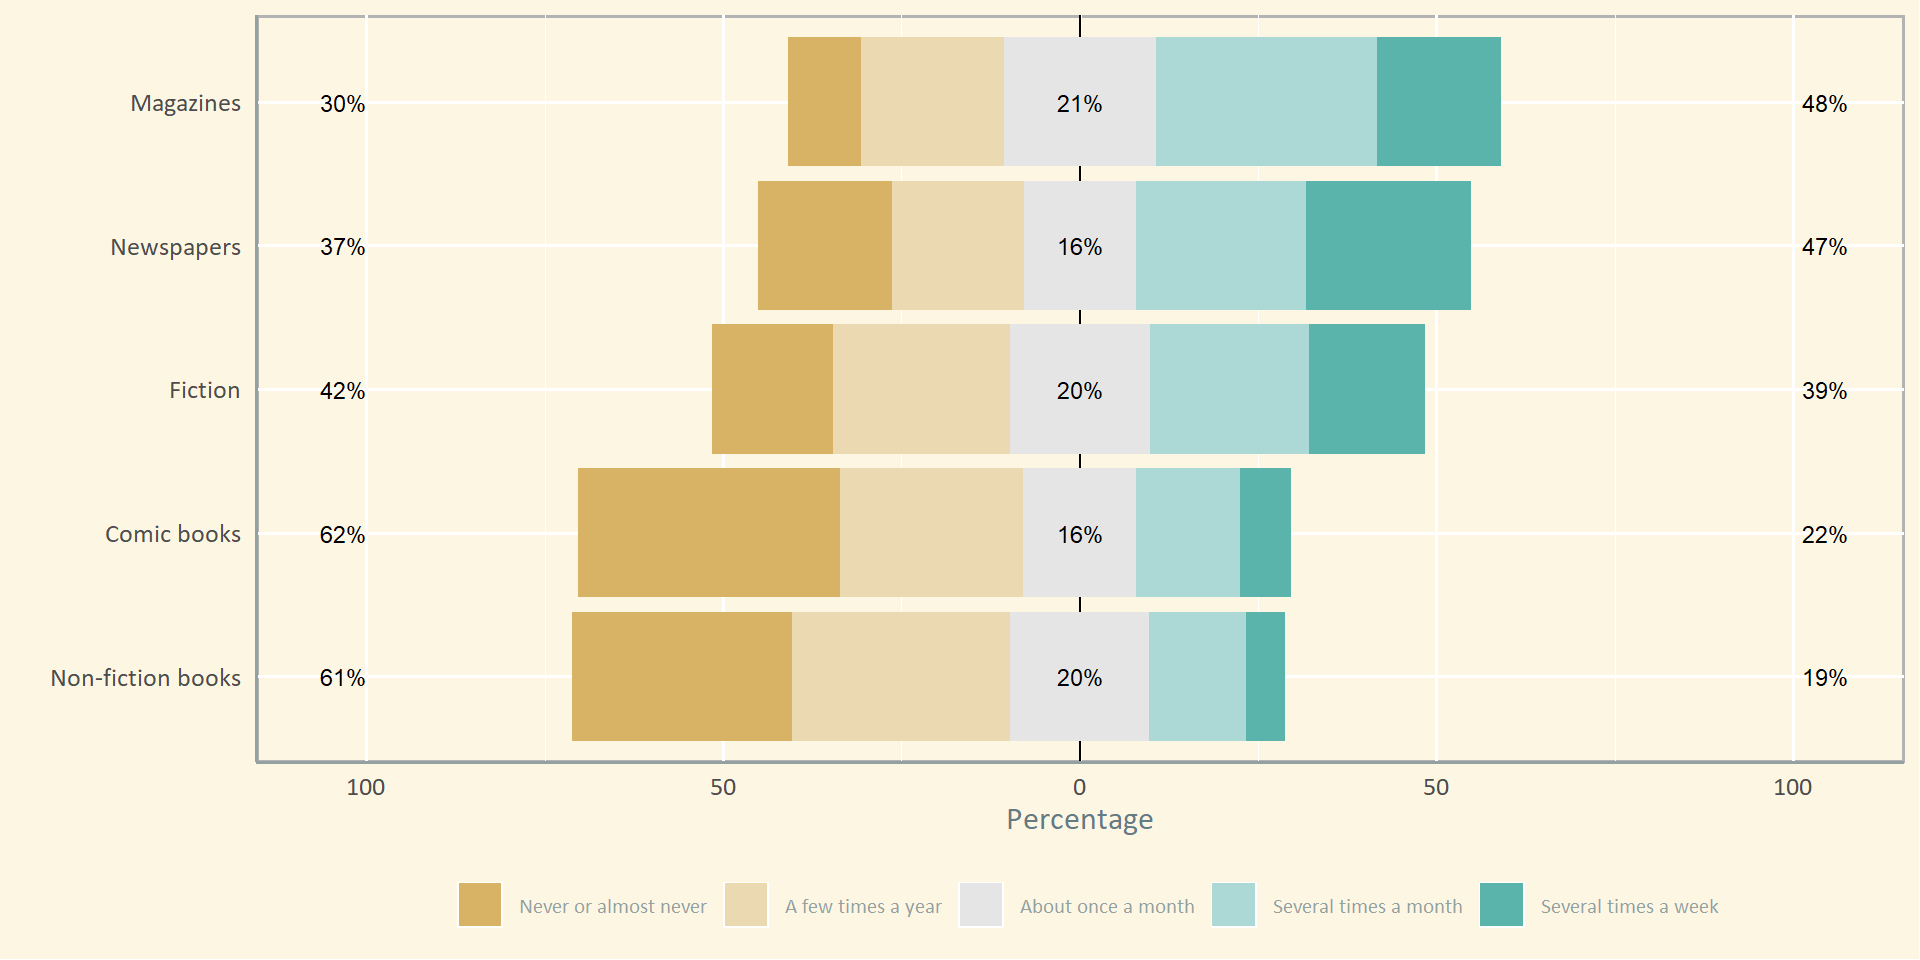
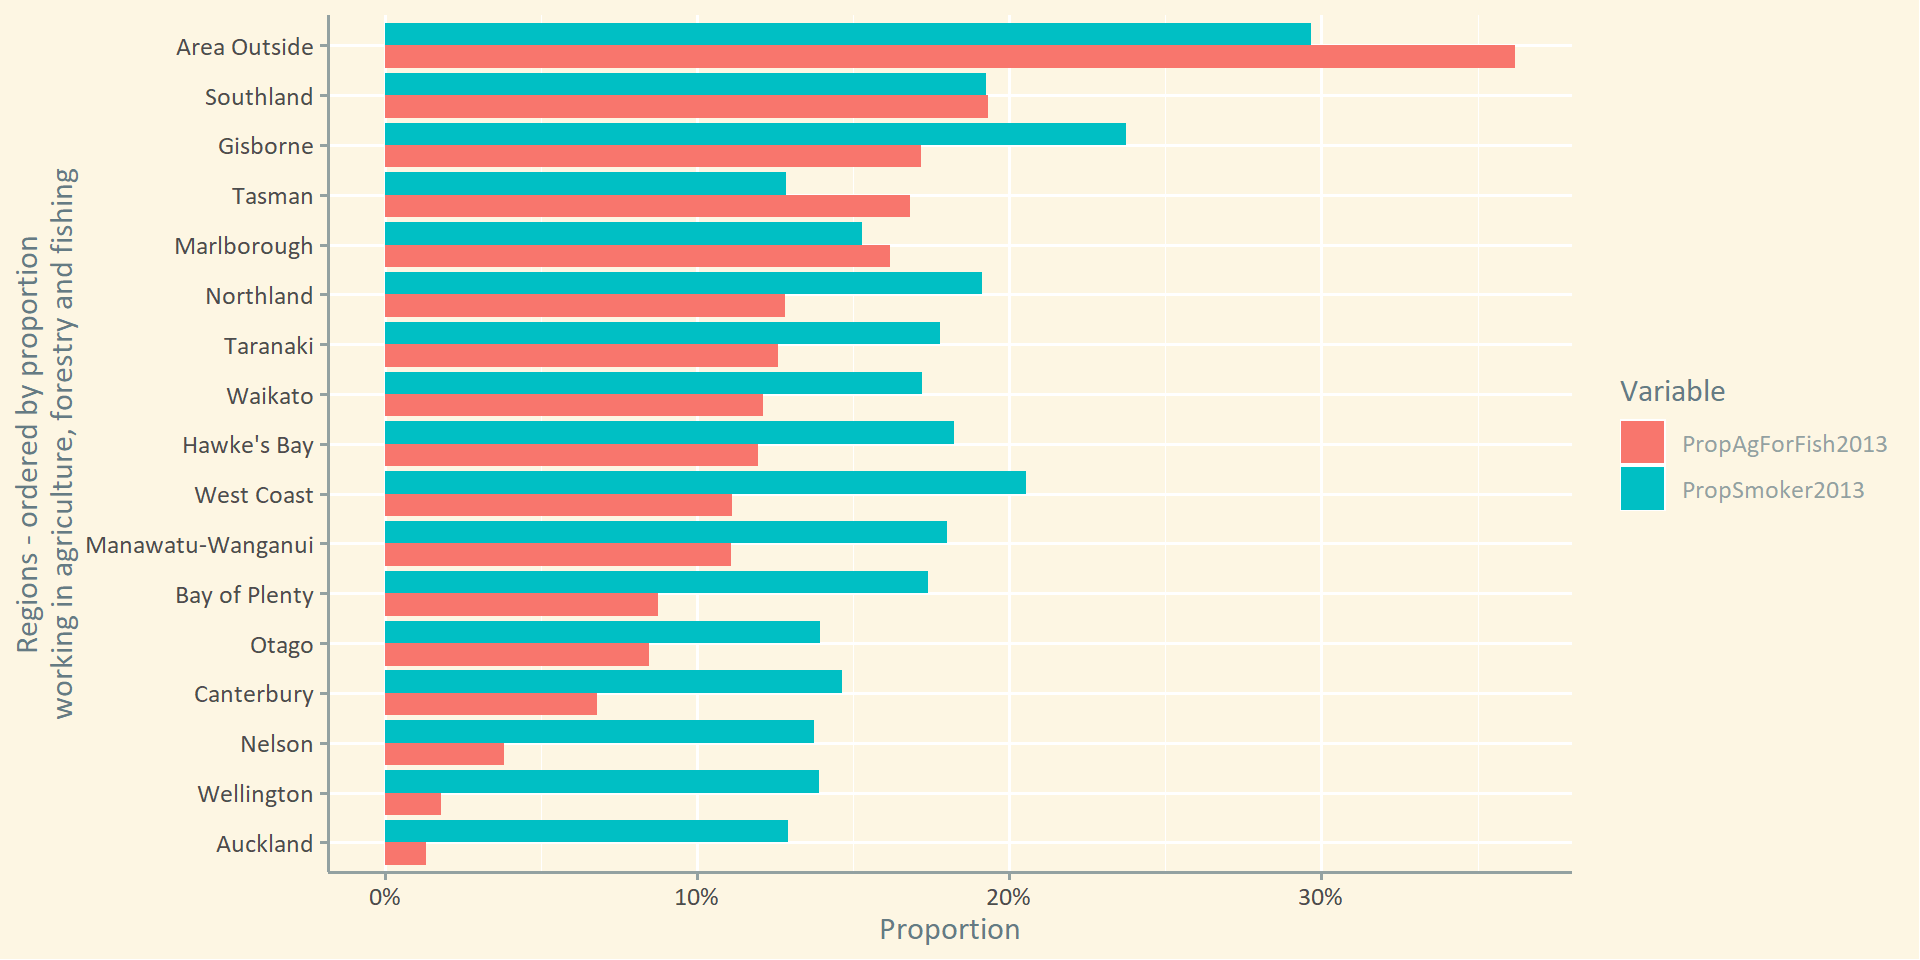
Typical stacked bars…

Orient for easy reading
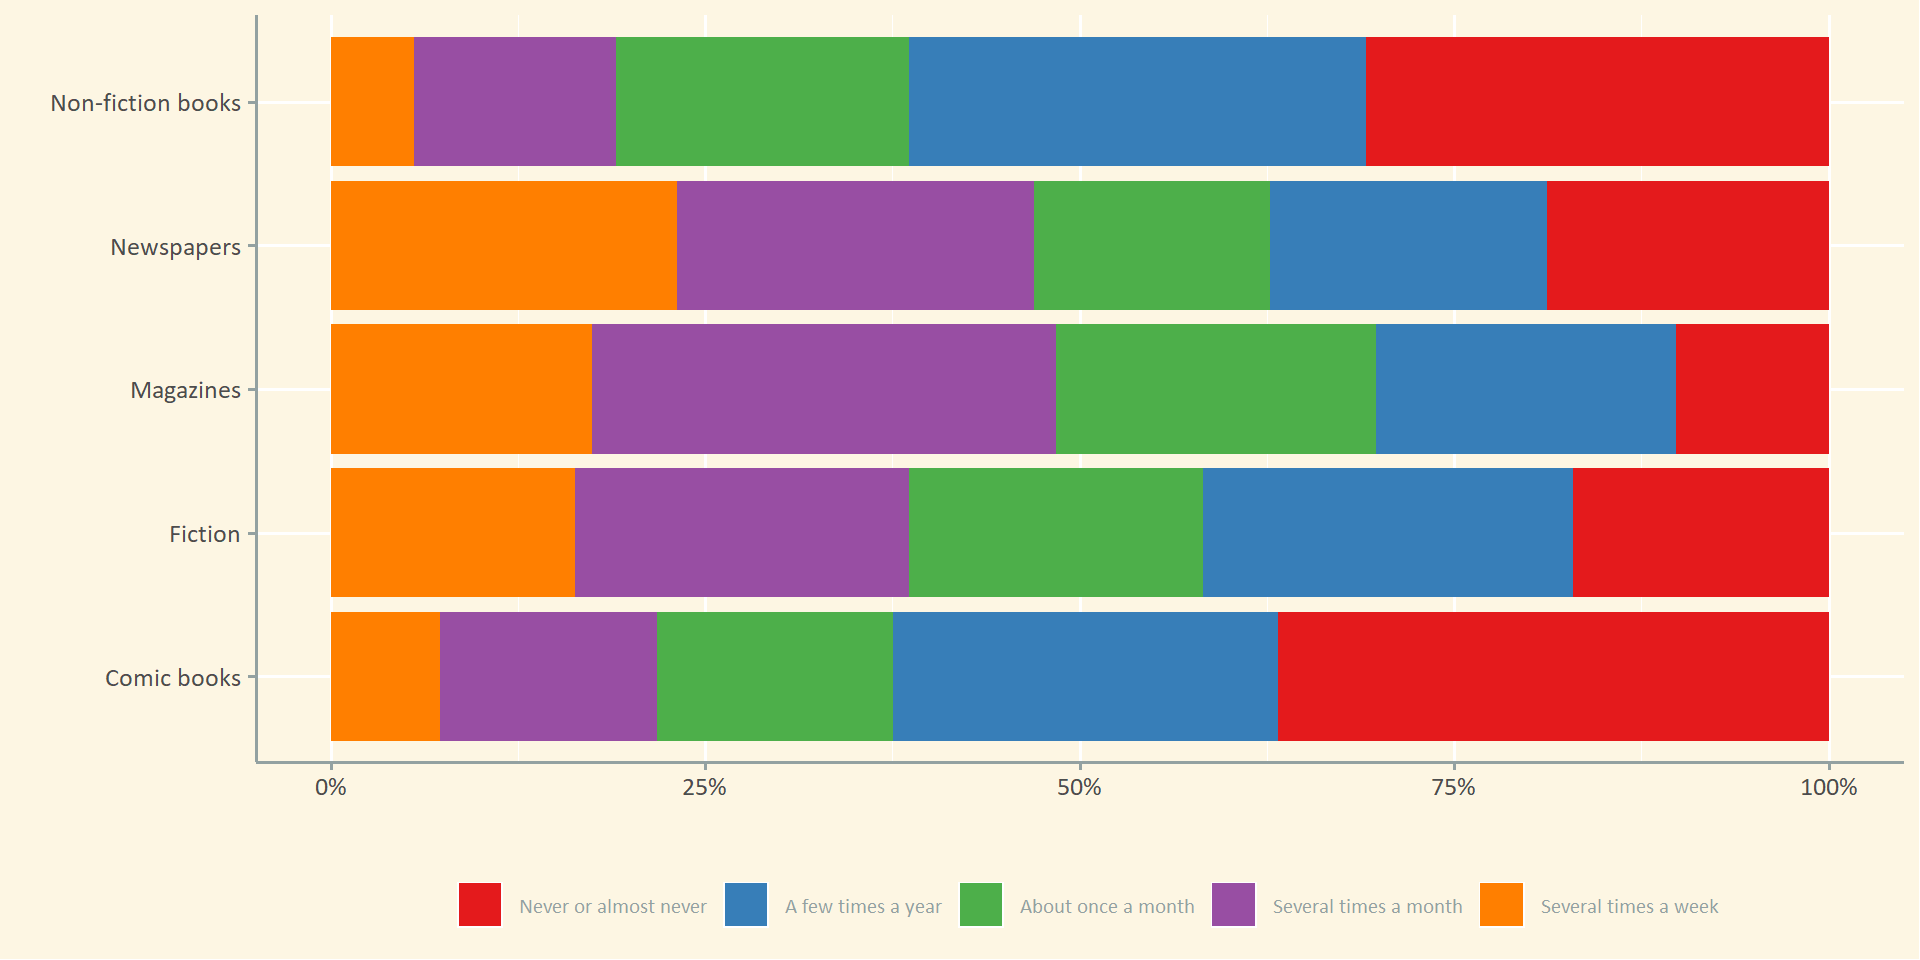
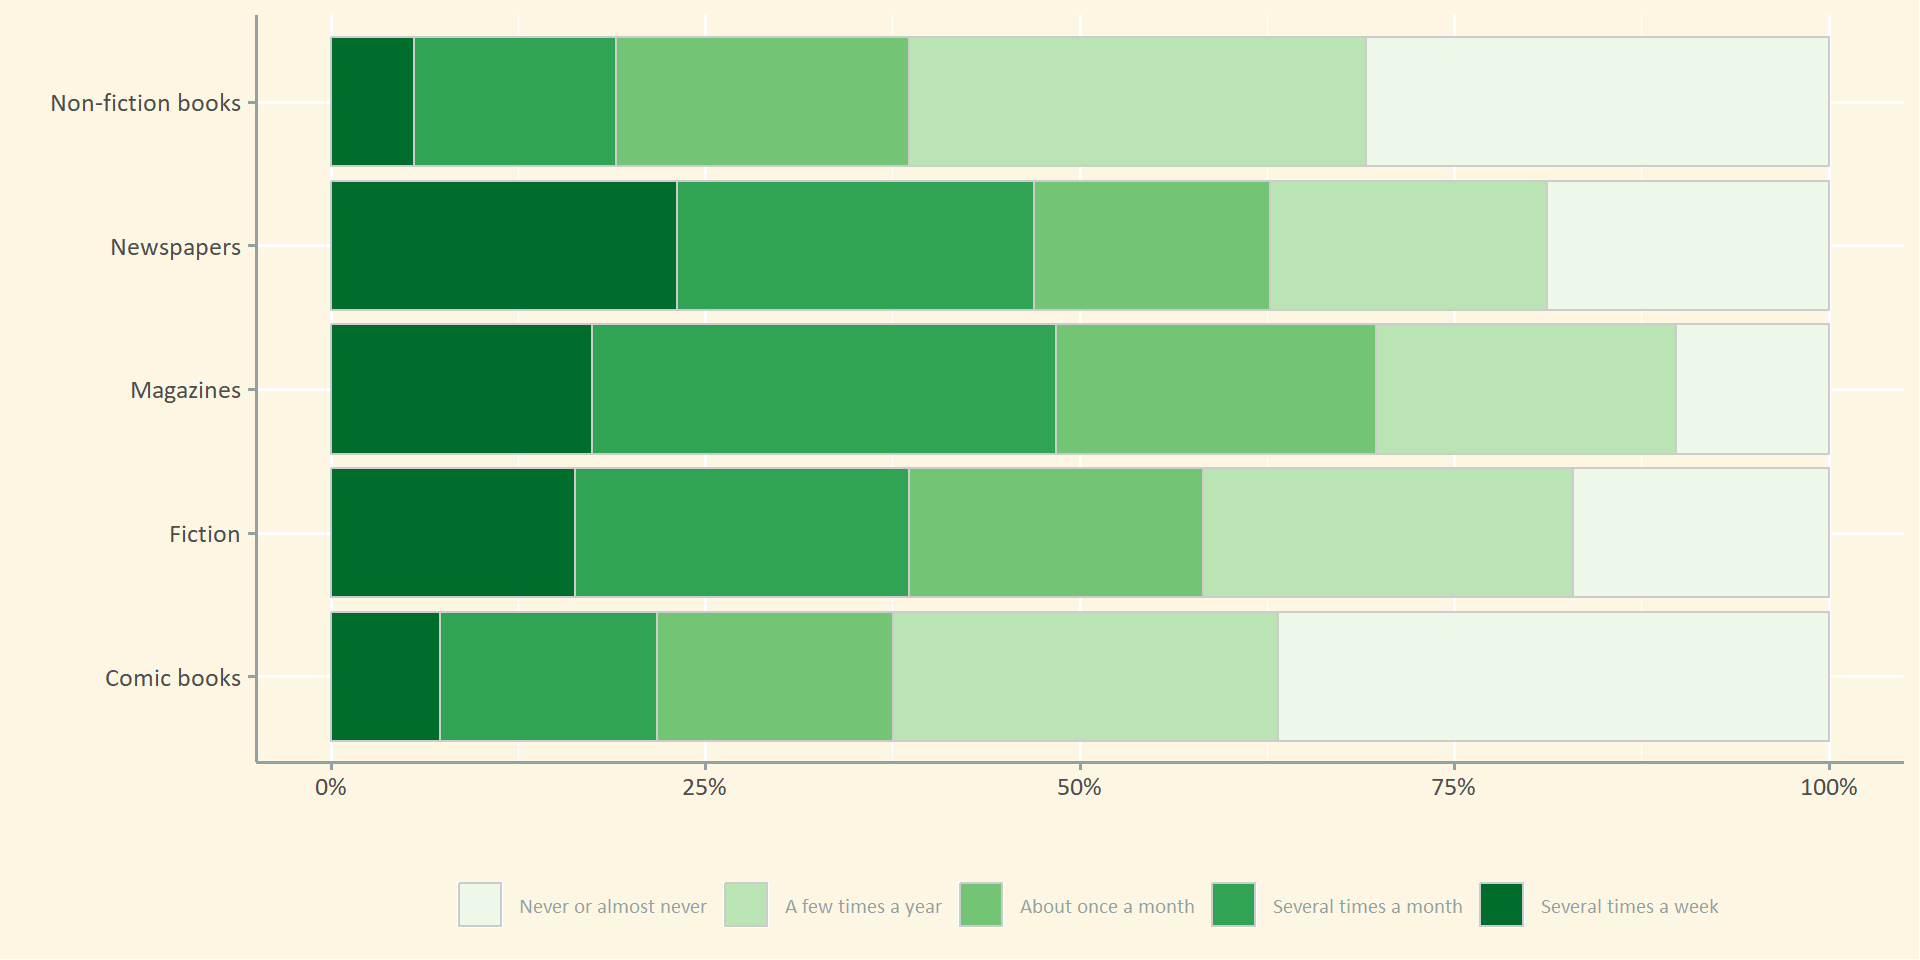
Sequential colours
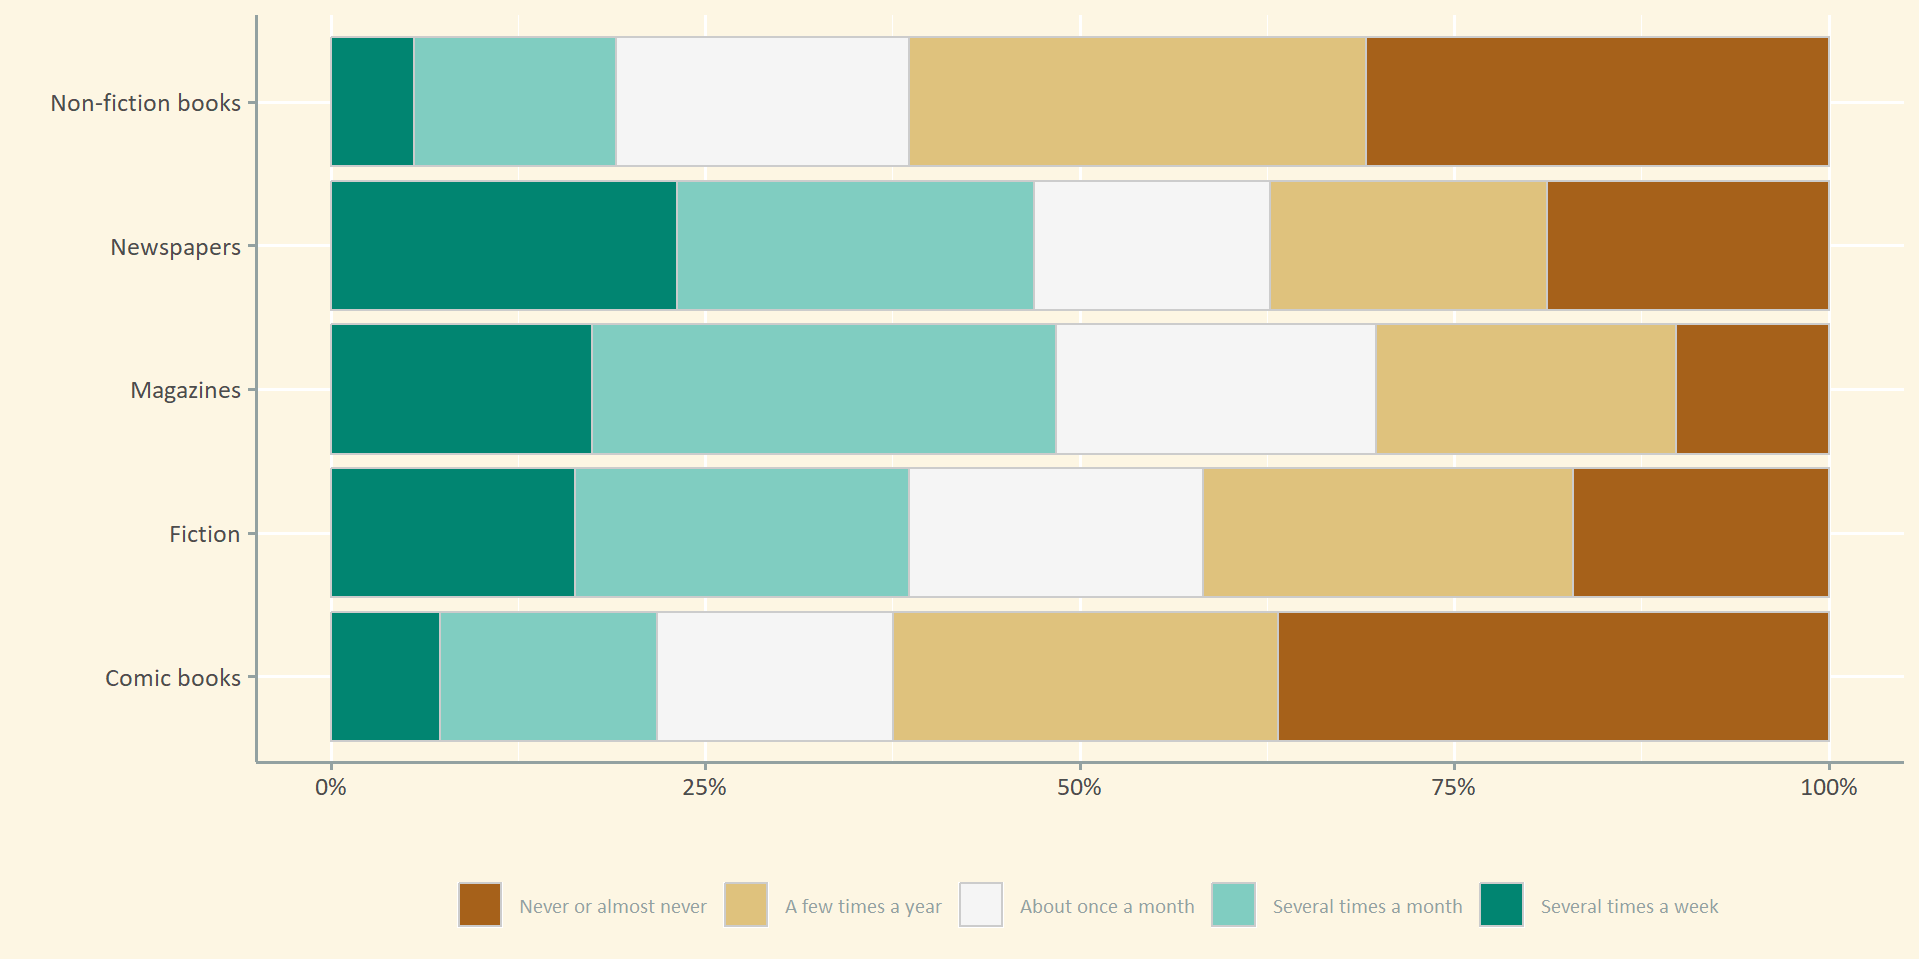
Diverging scale
Use position
Much better than

Cluttered
Minimal axis guides
Fade axis title
Remove borders
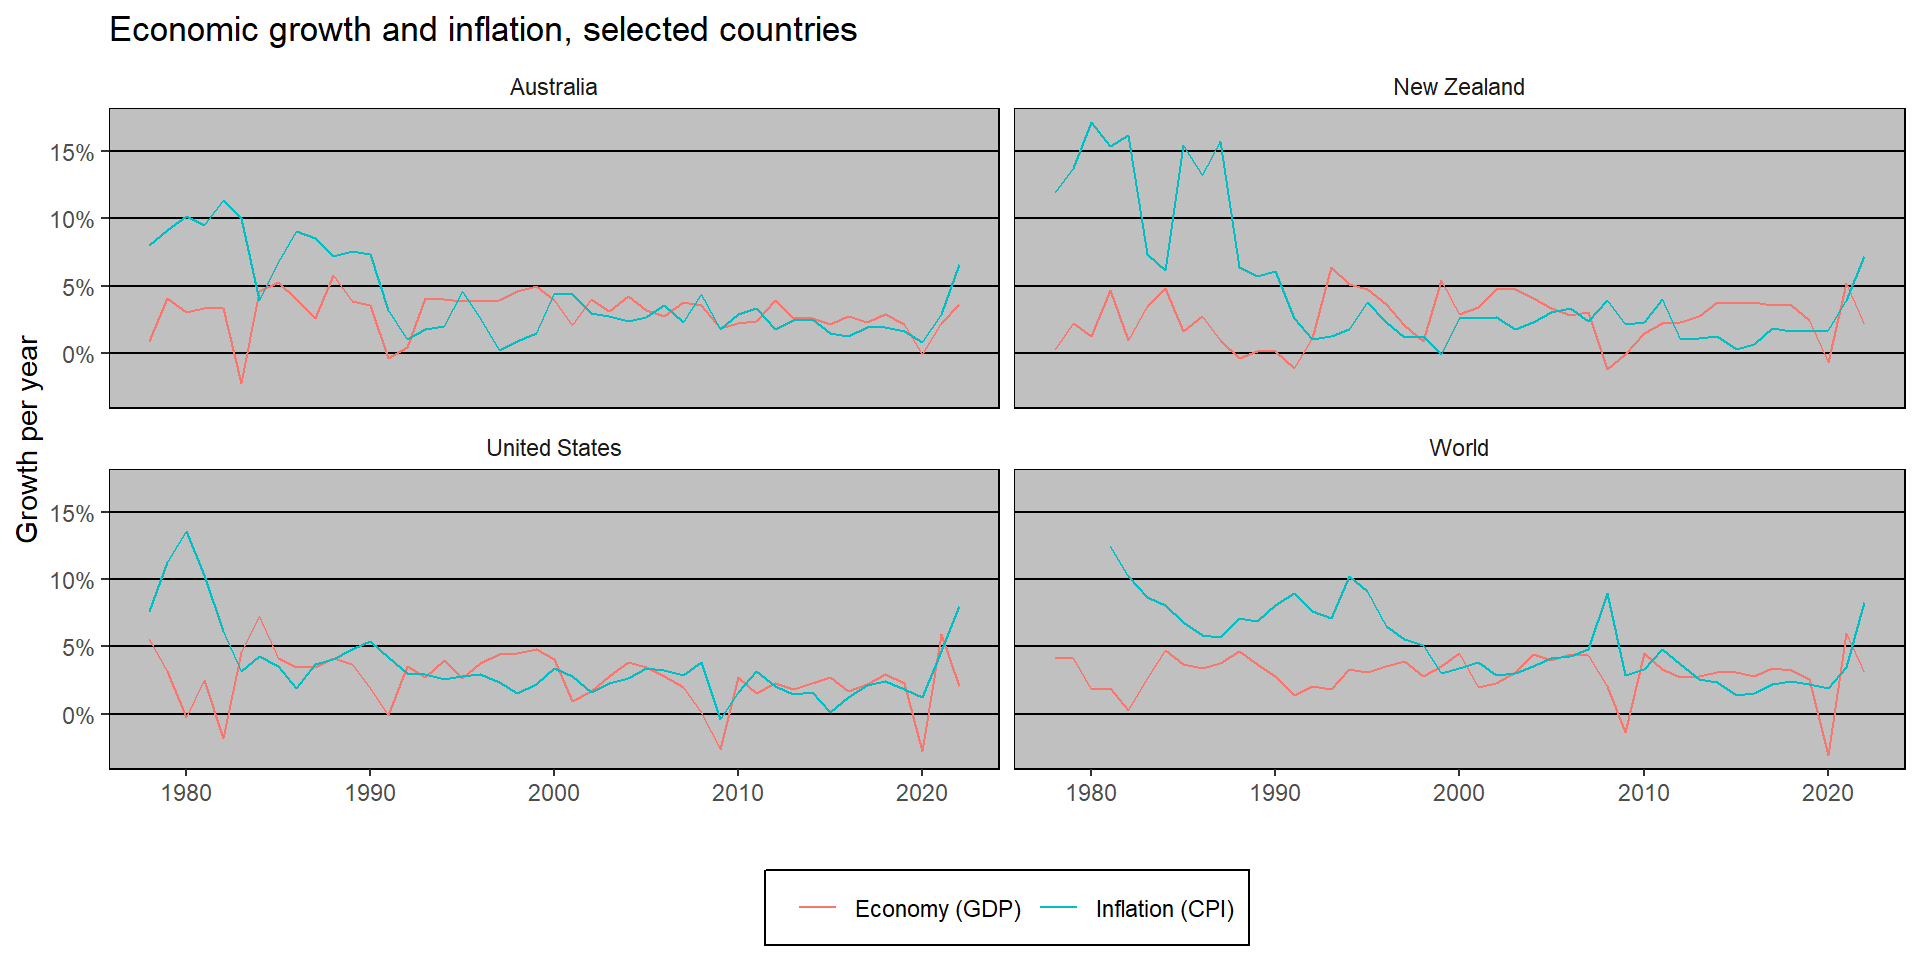
Remove boxes
Guidelines to back
Background to back
Consistent doc theme
Consistent font
Corporate colours
Direct labels
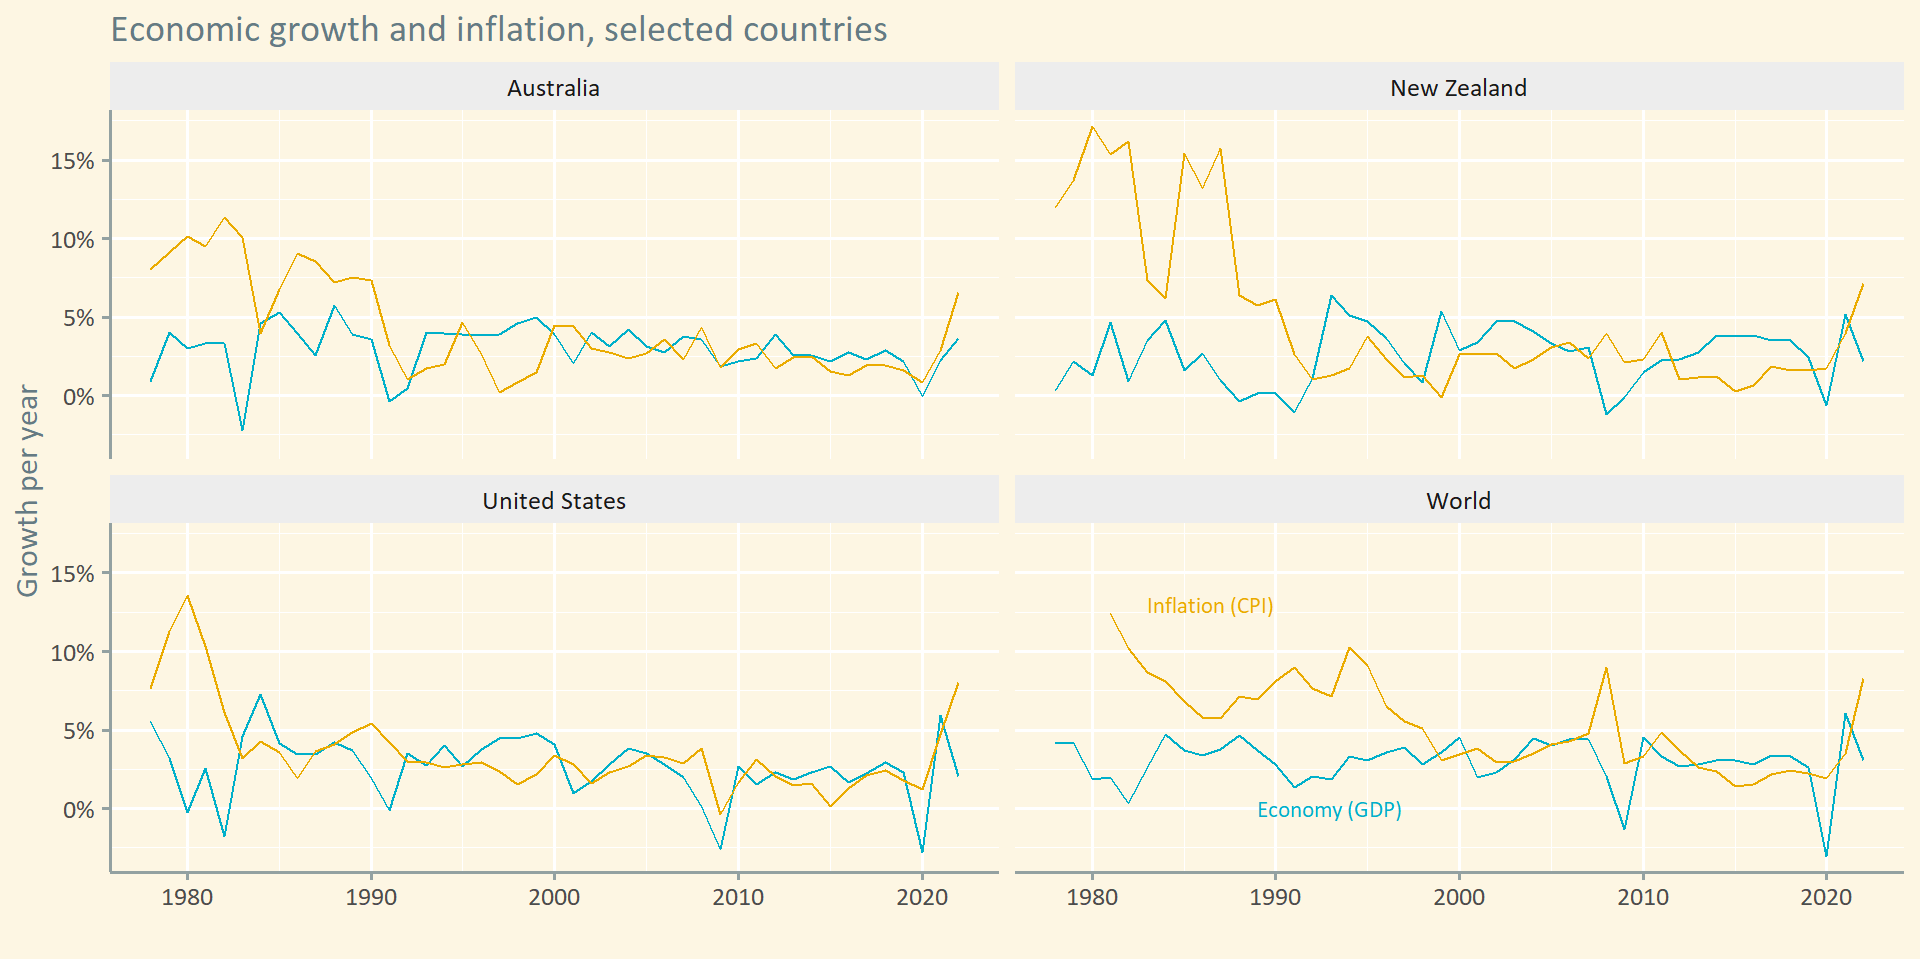
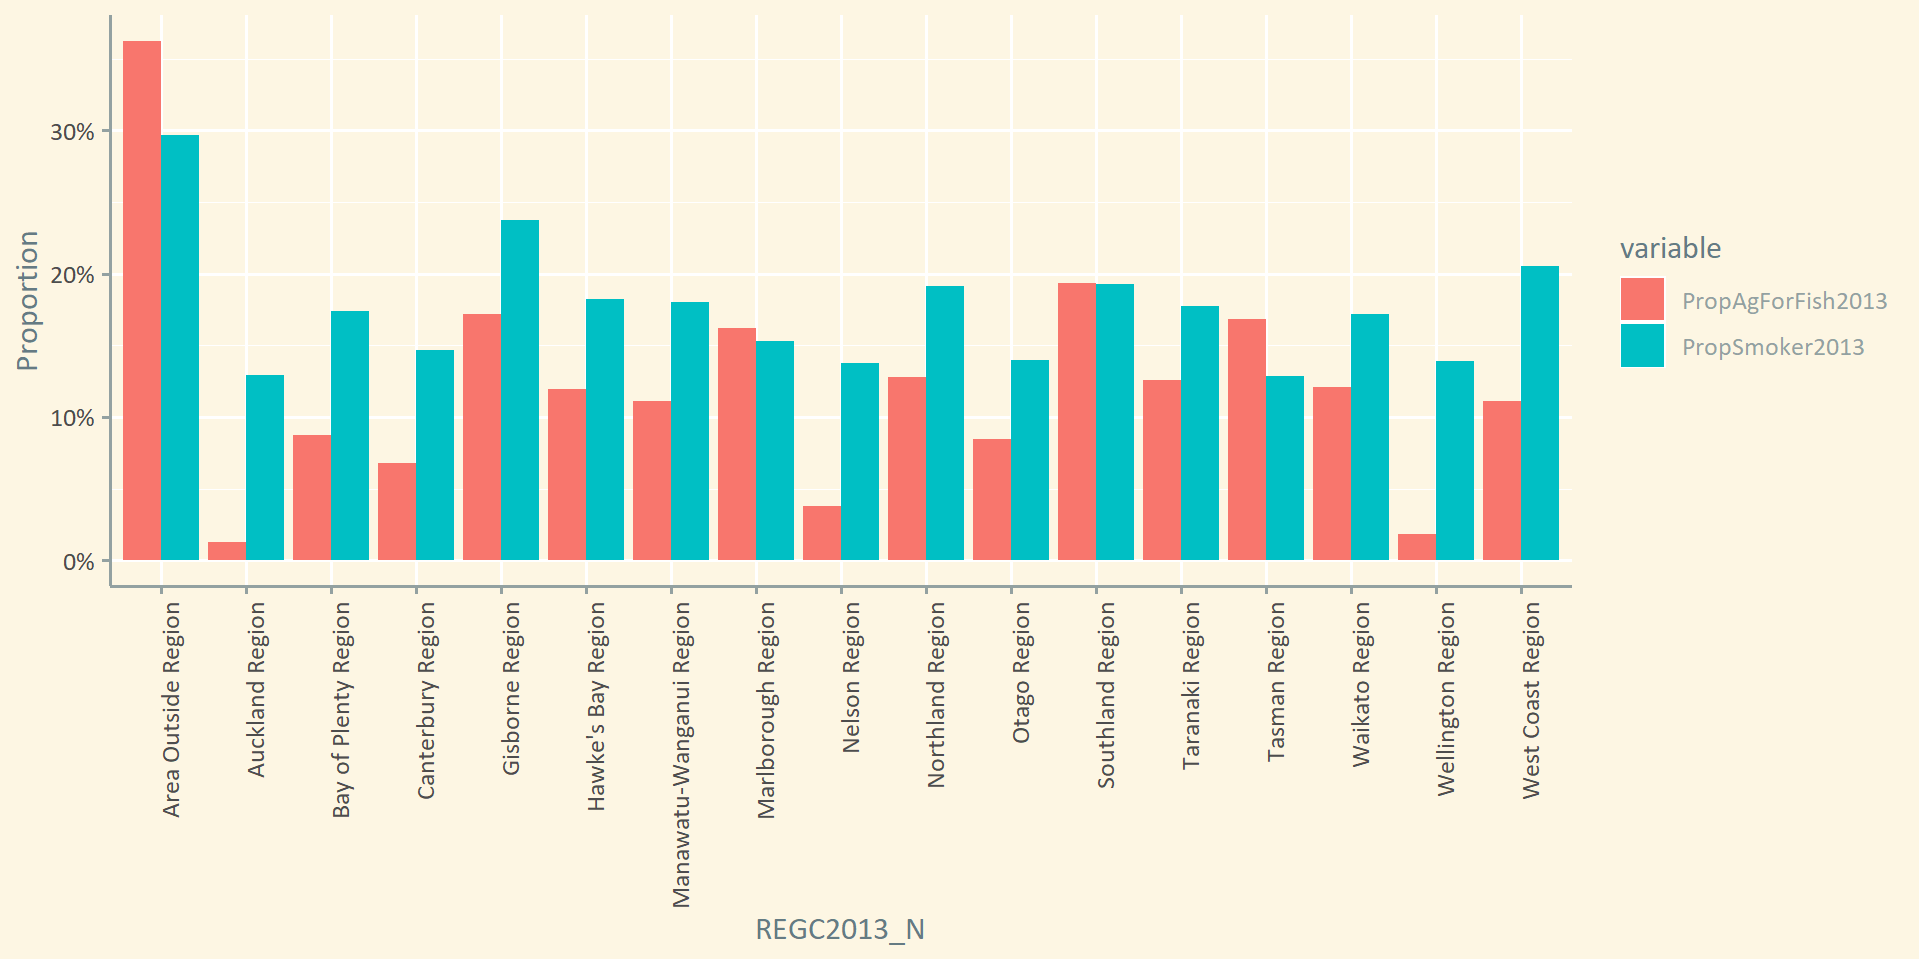
Much better than:
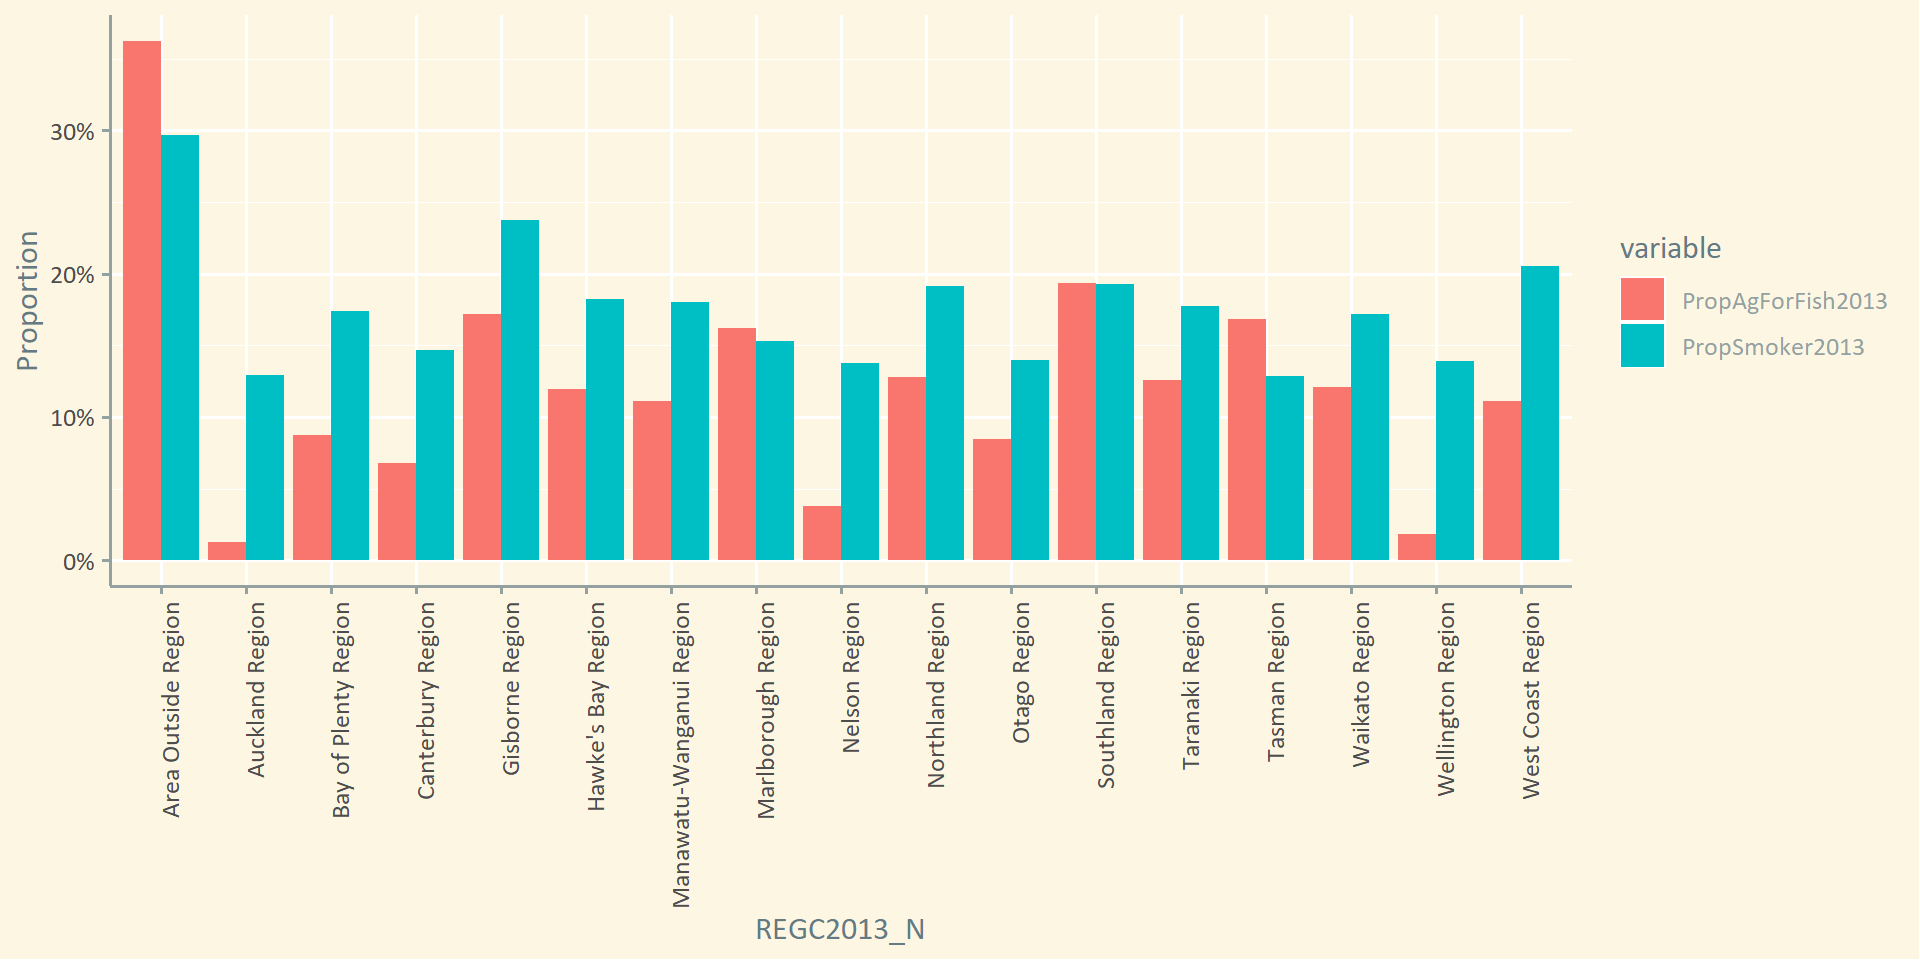
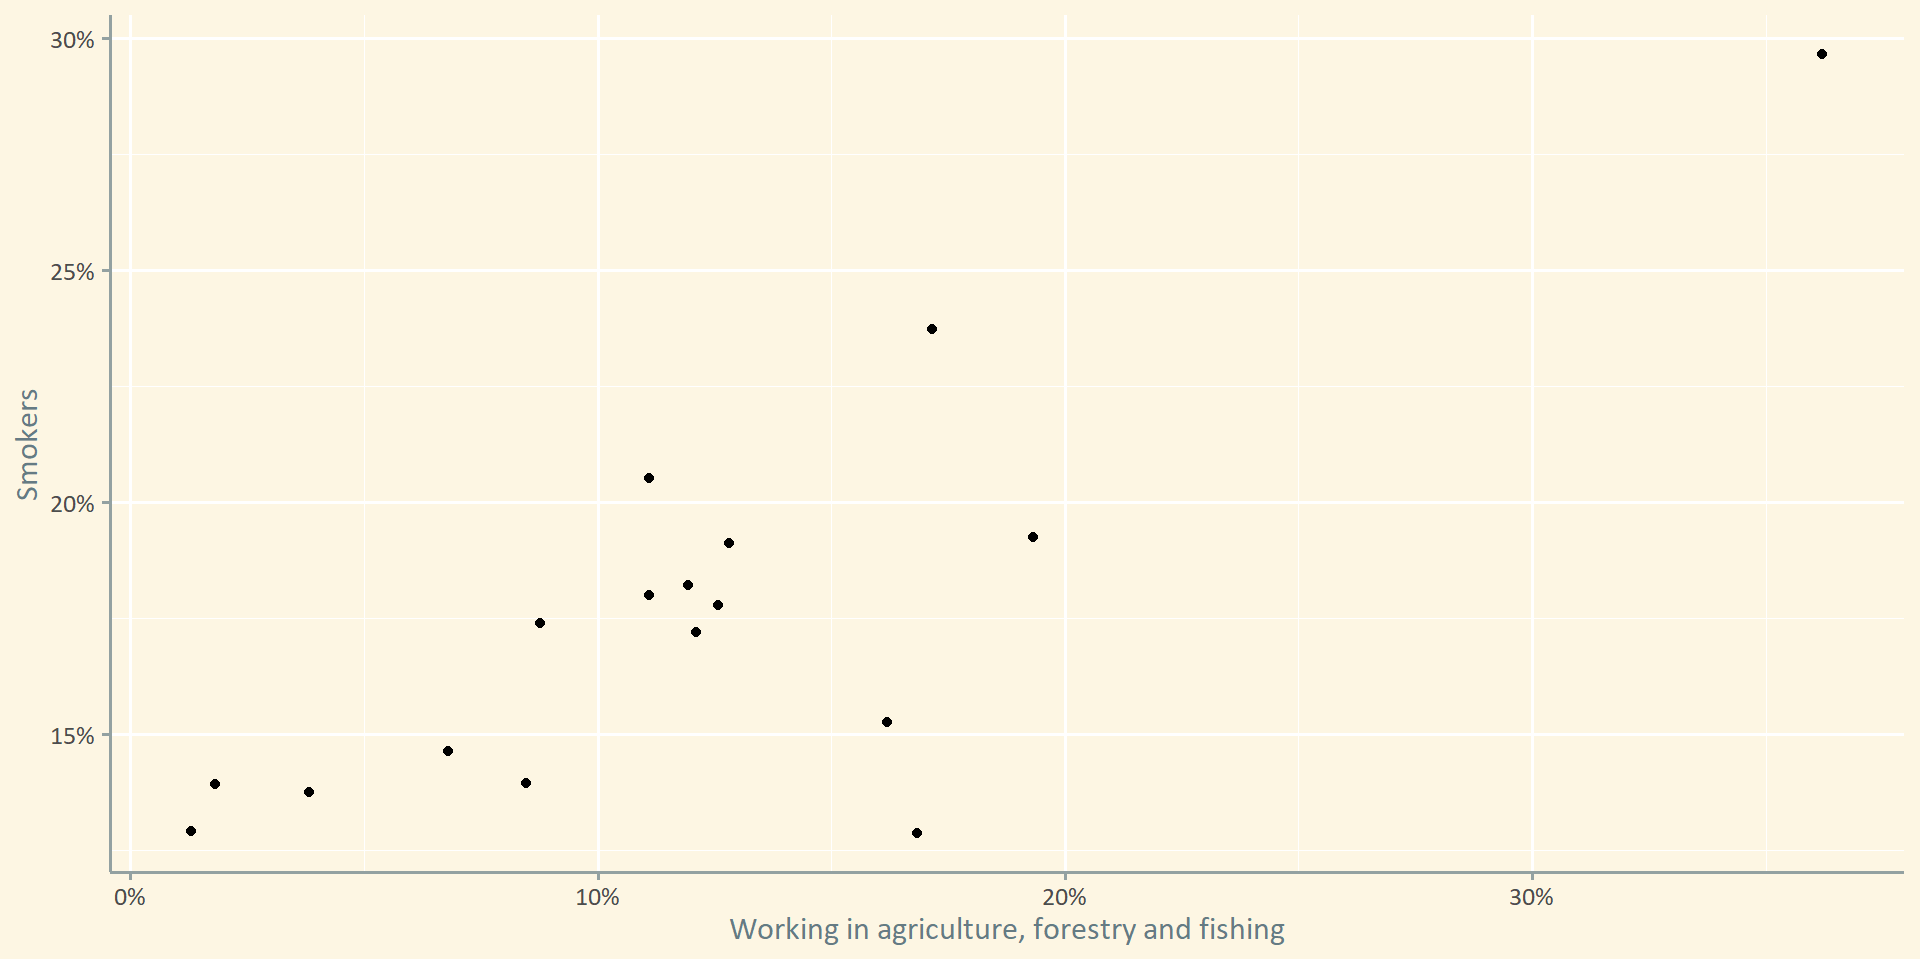
Original
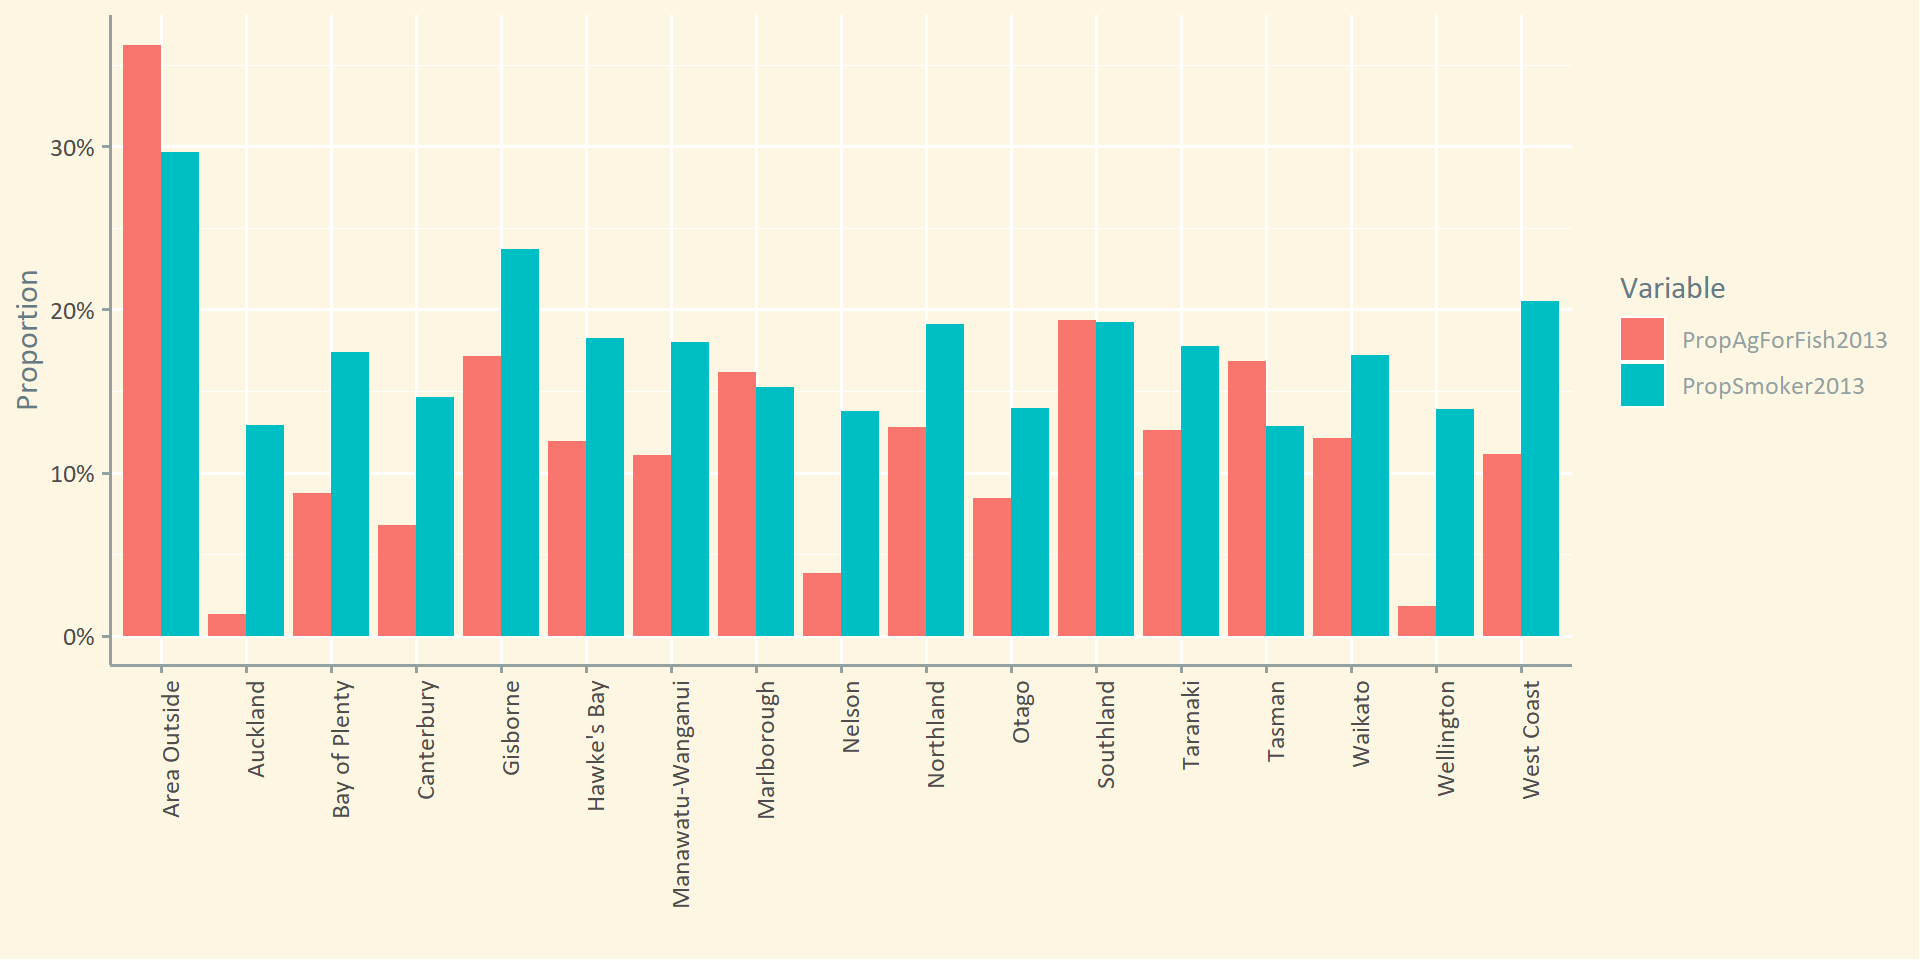
User-friendly labels
Horizontal text
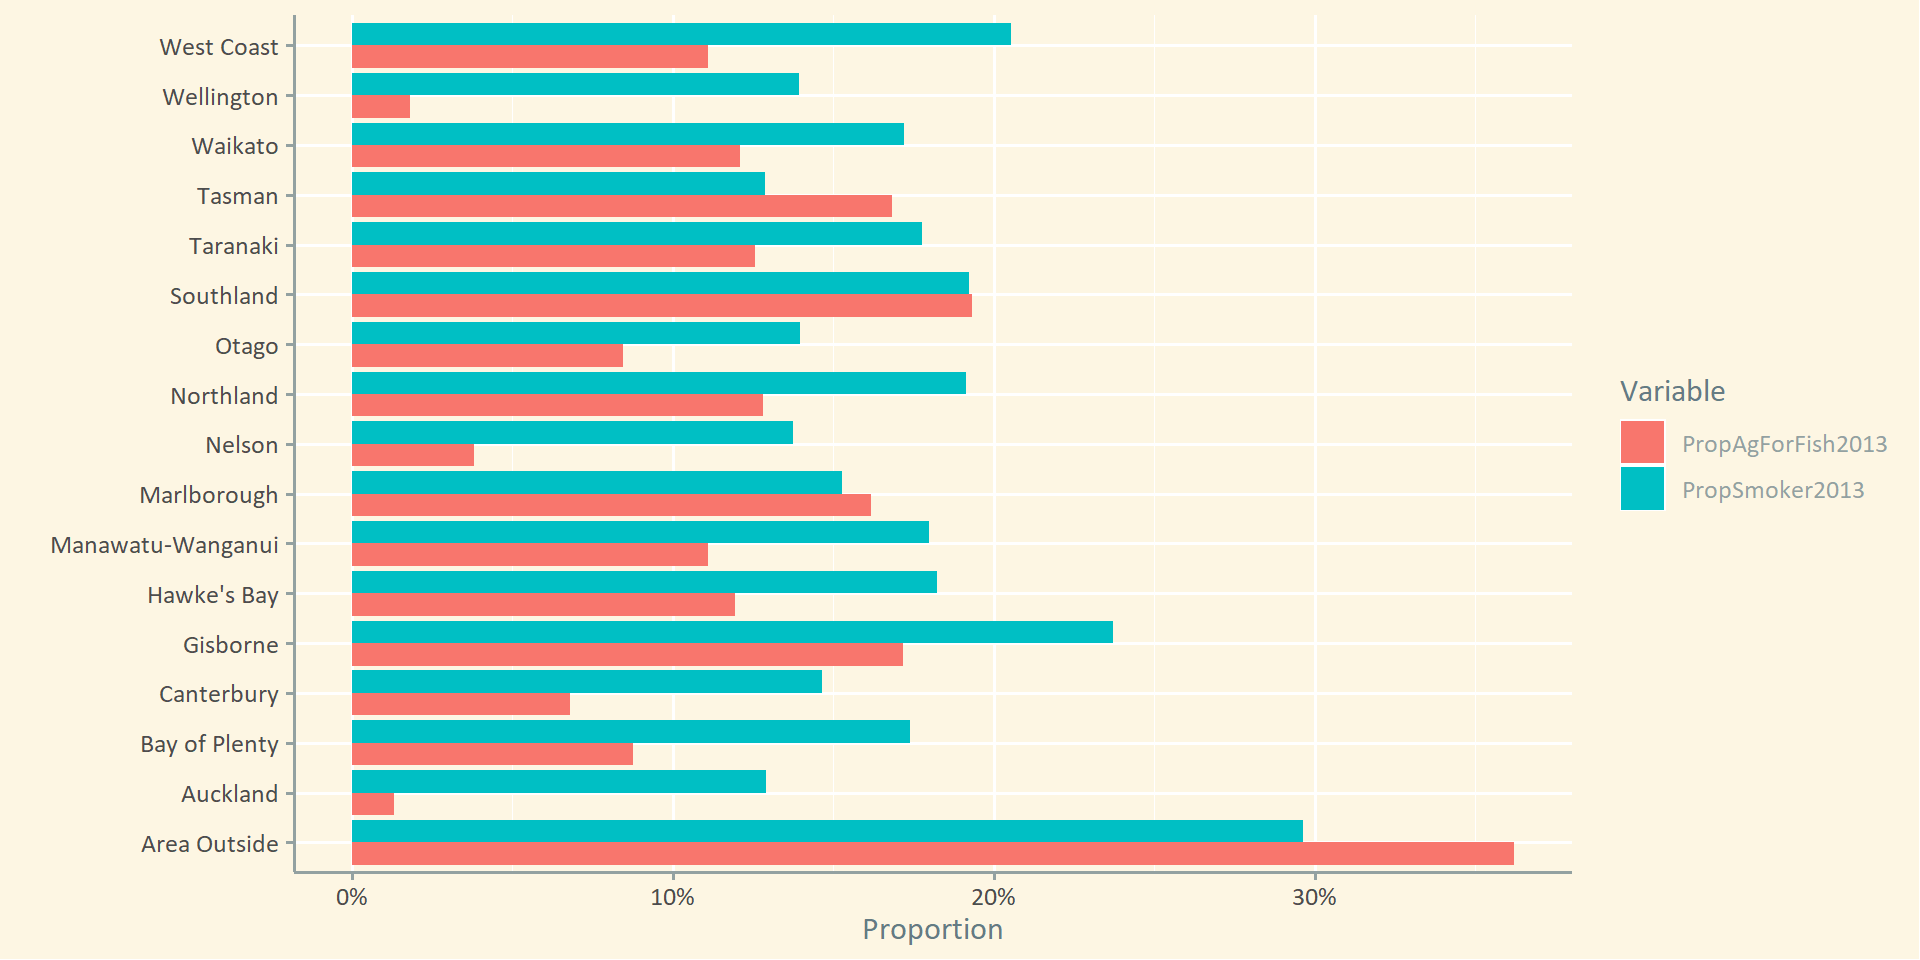
Meaningful ordering
Better shape and geom
Labels on points
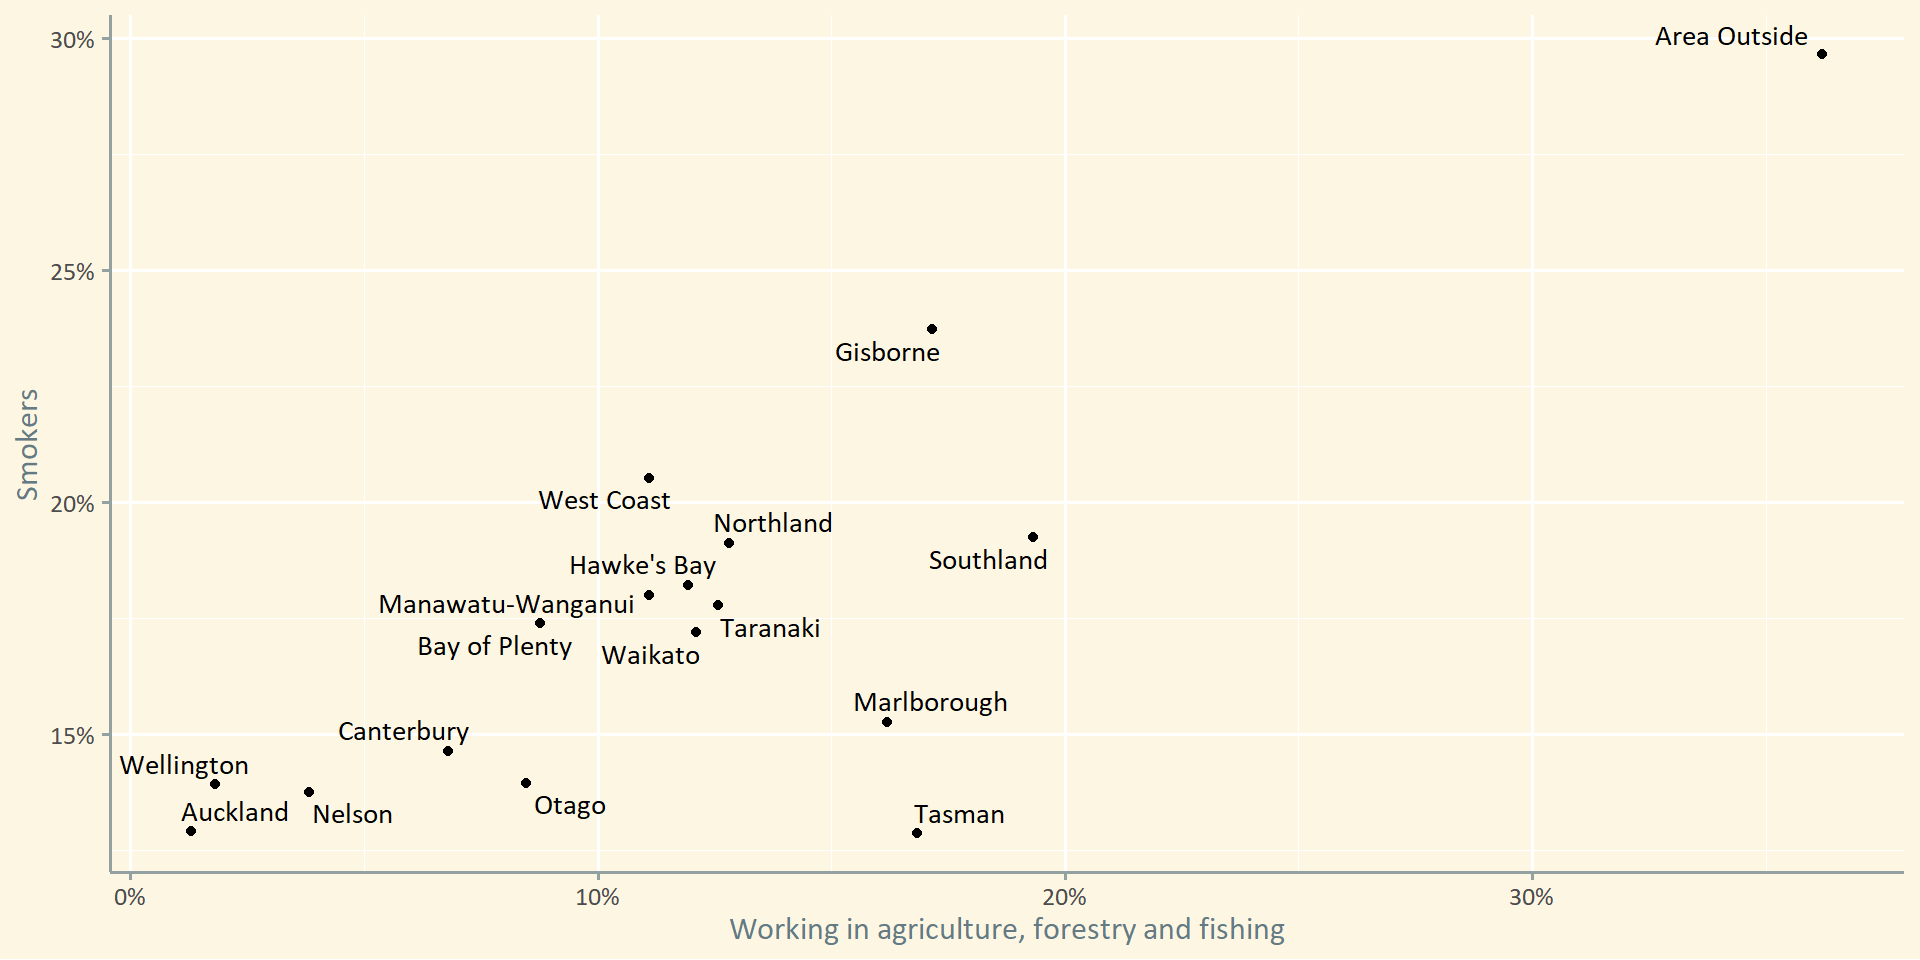
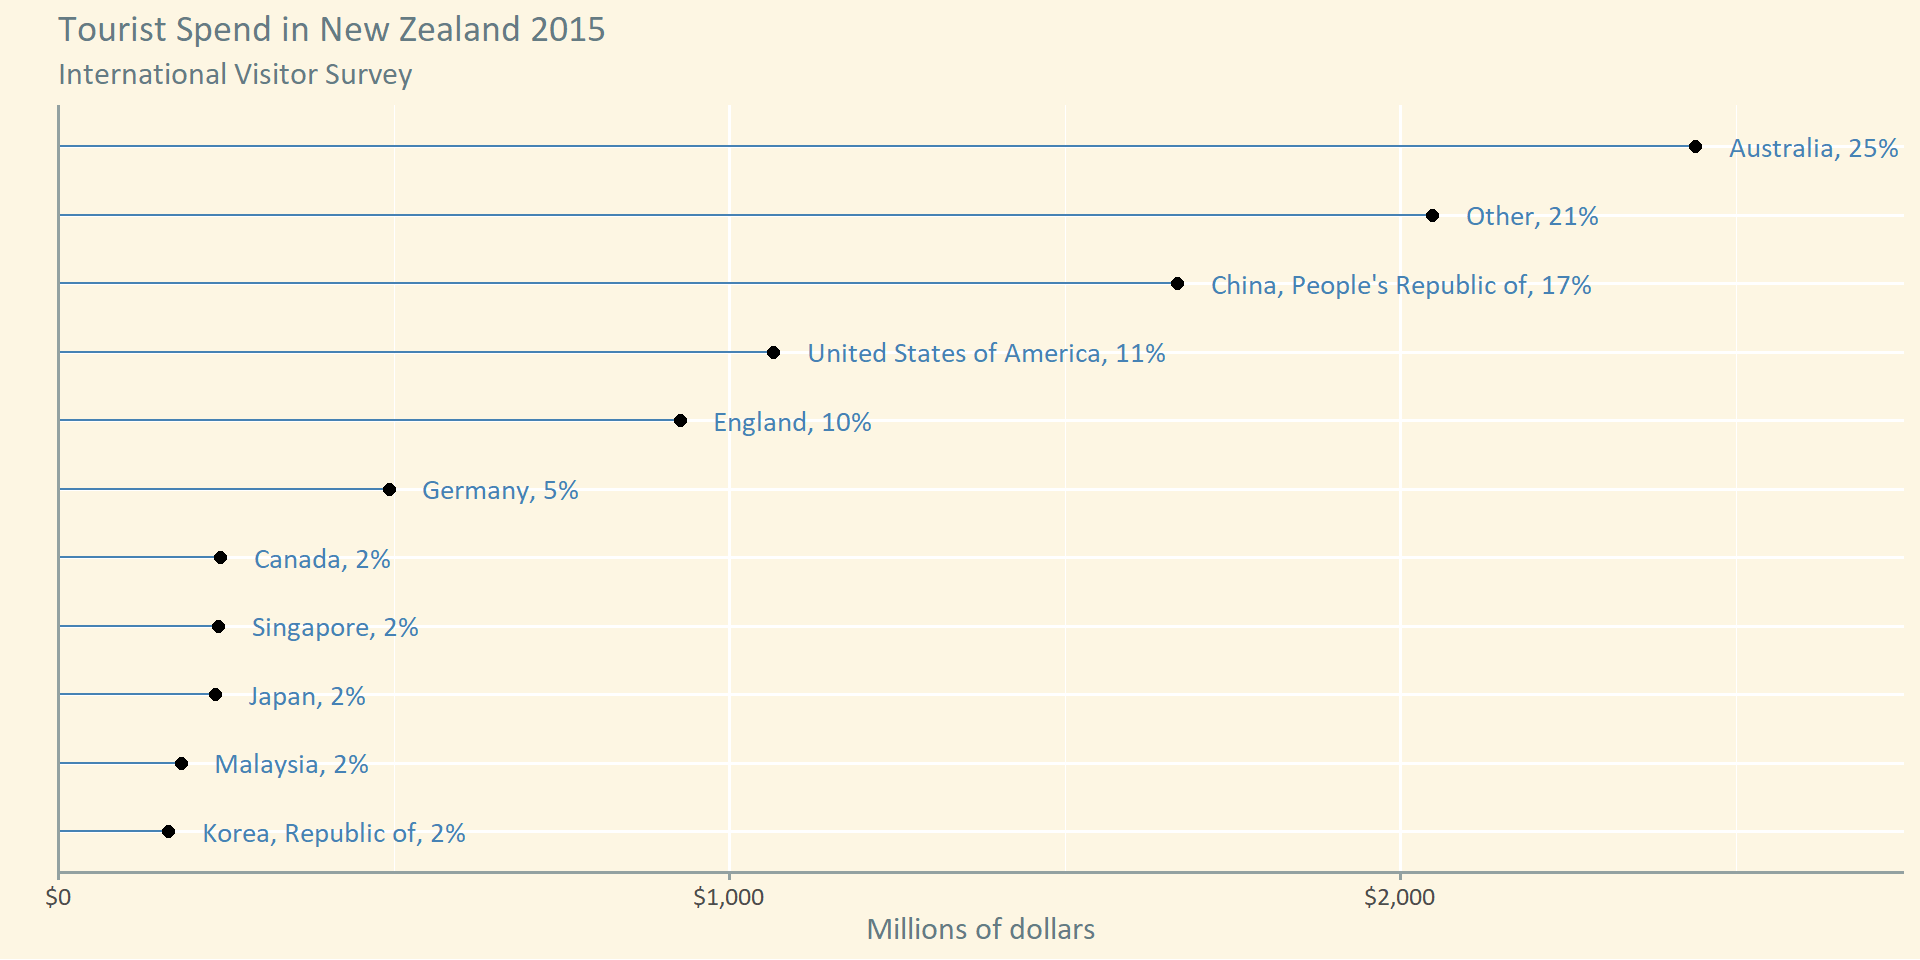
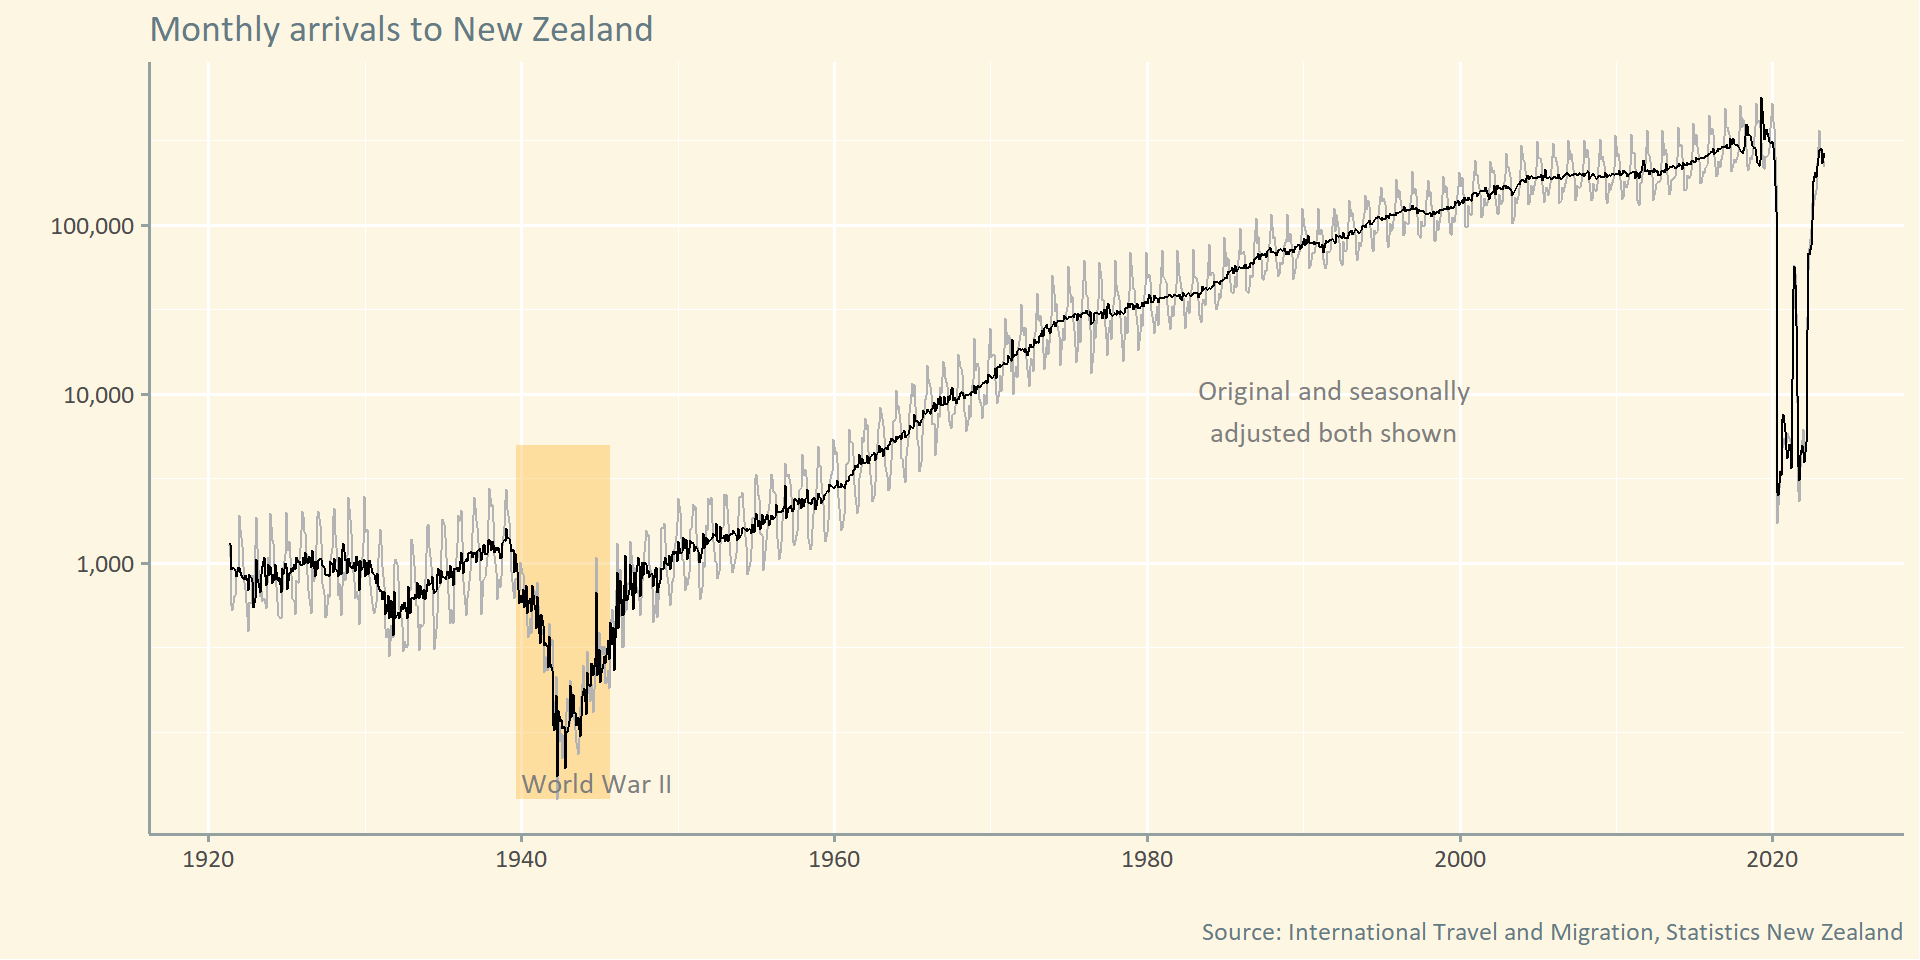
Title and annotation
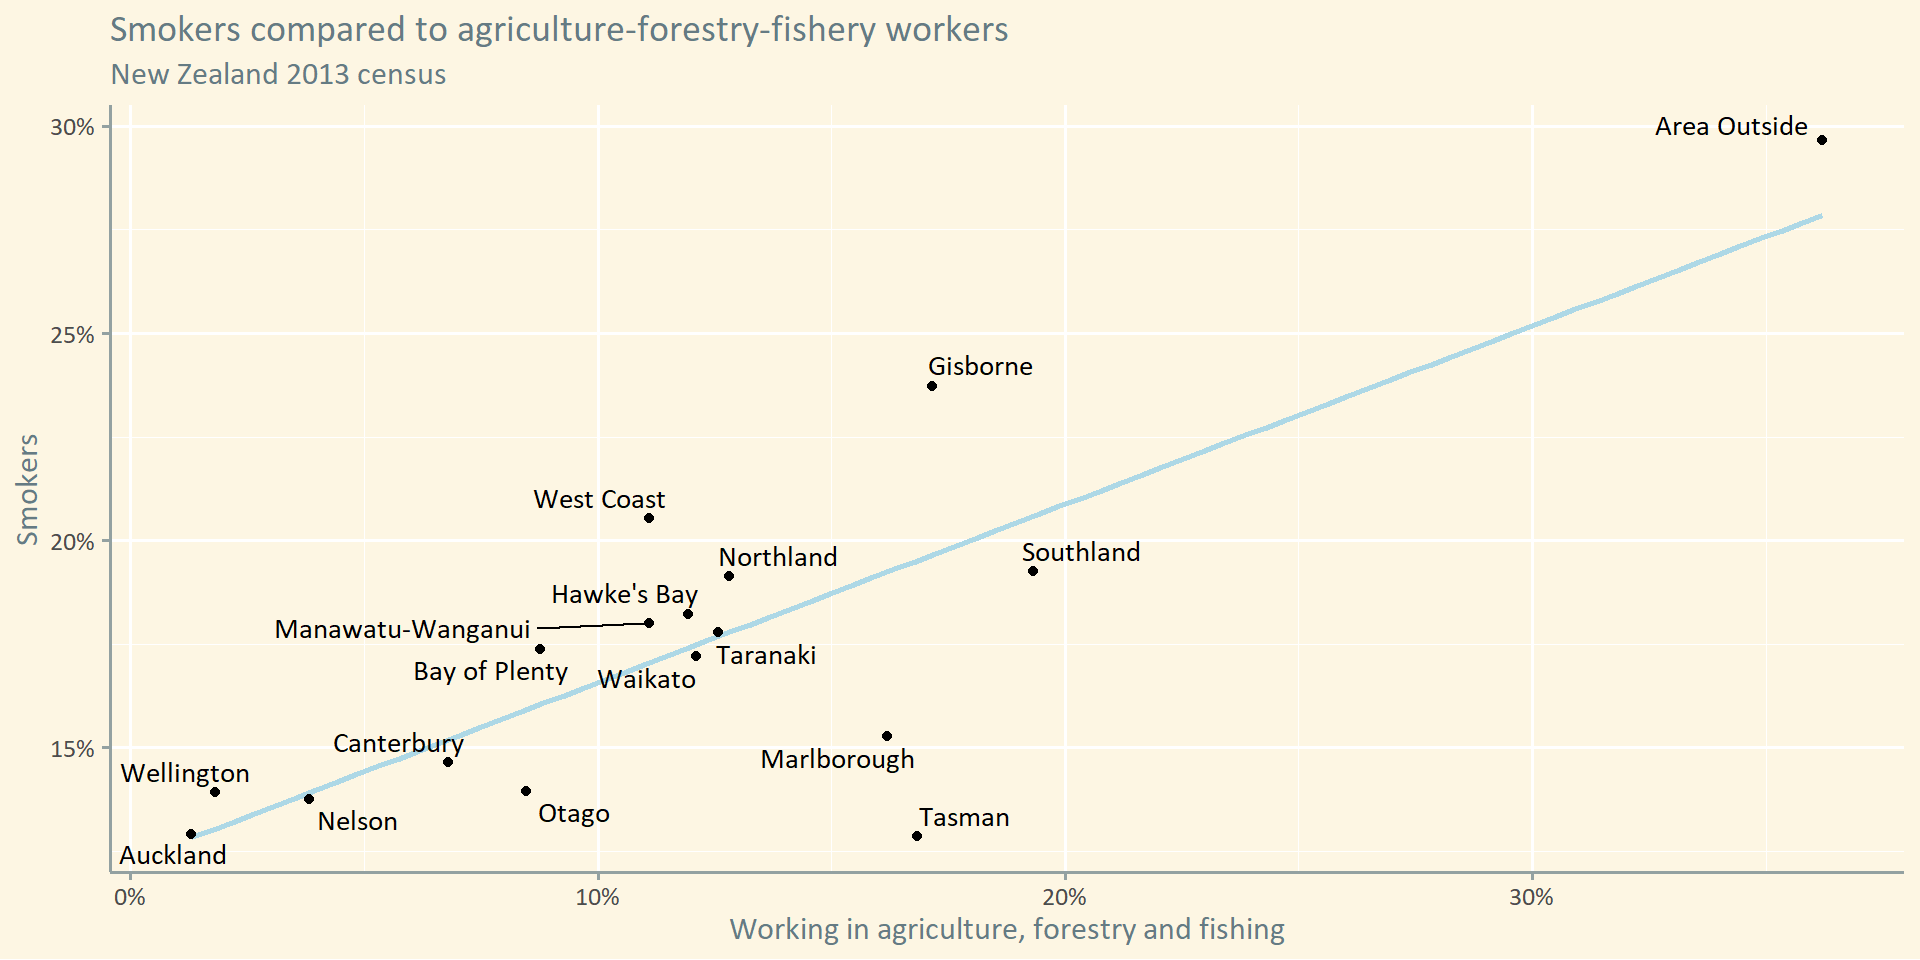
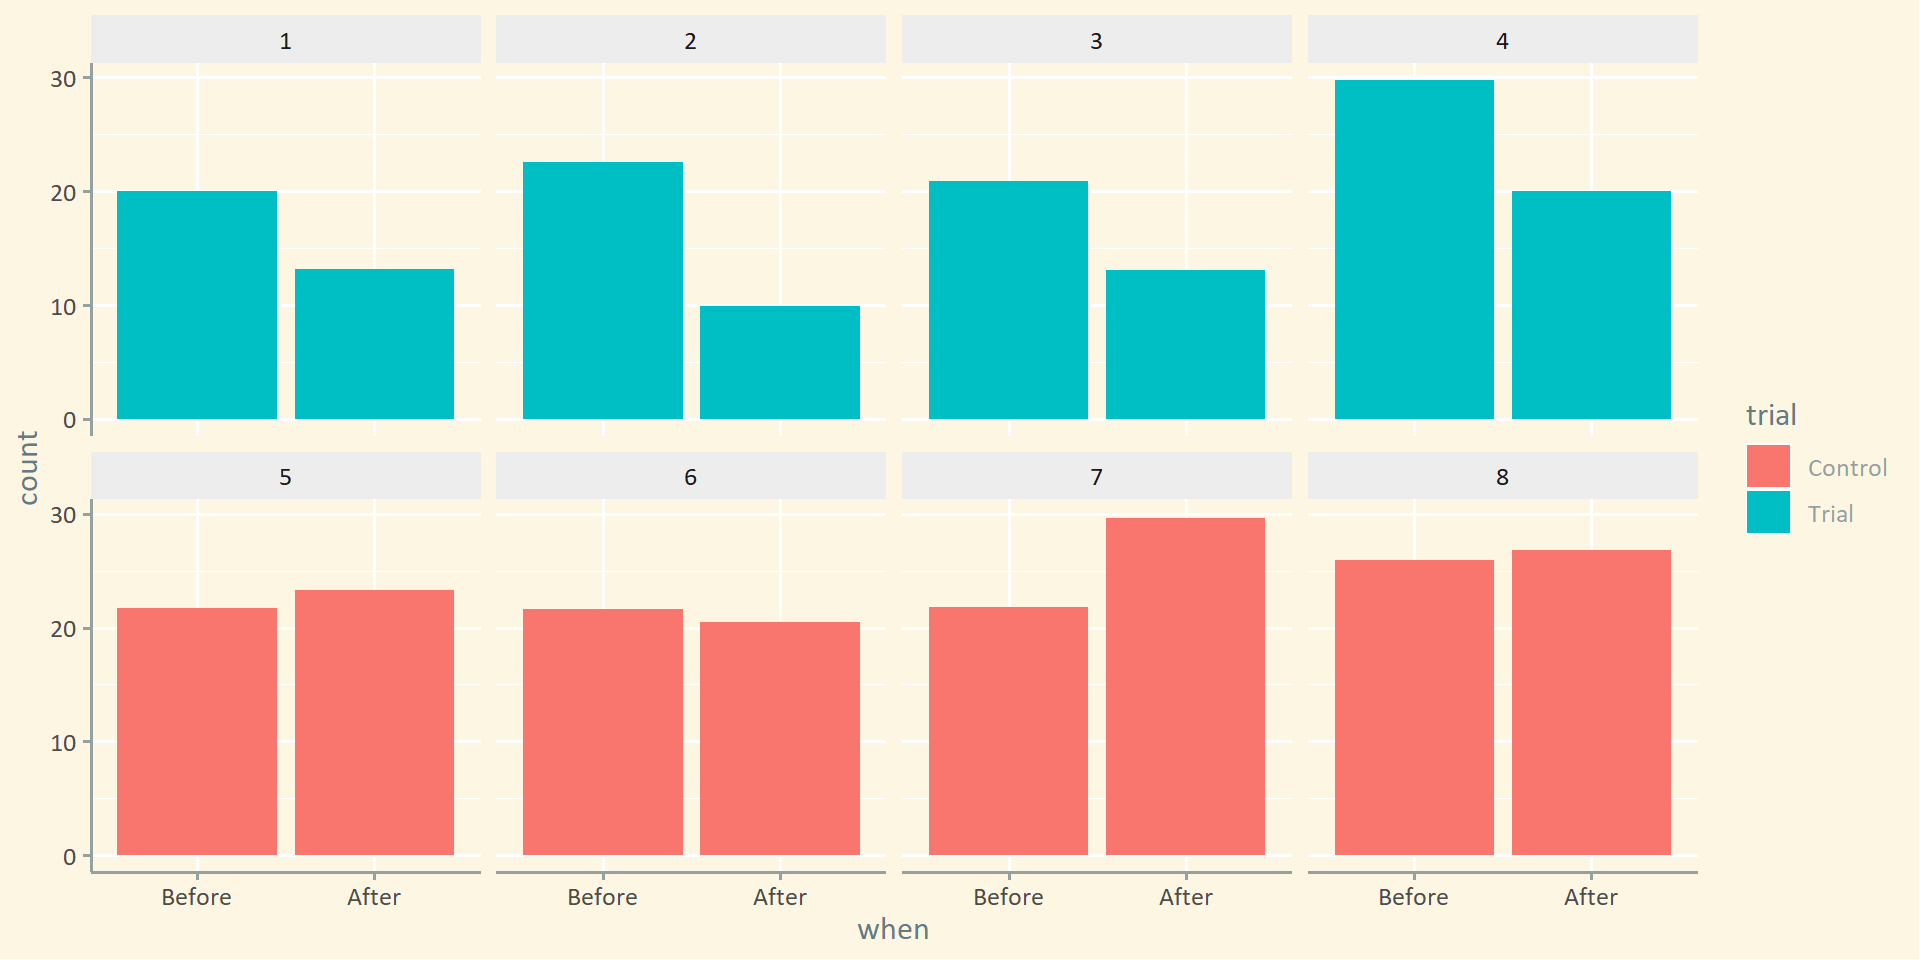
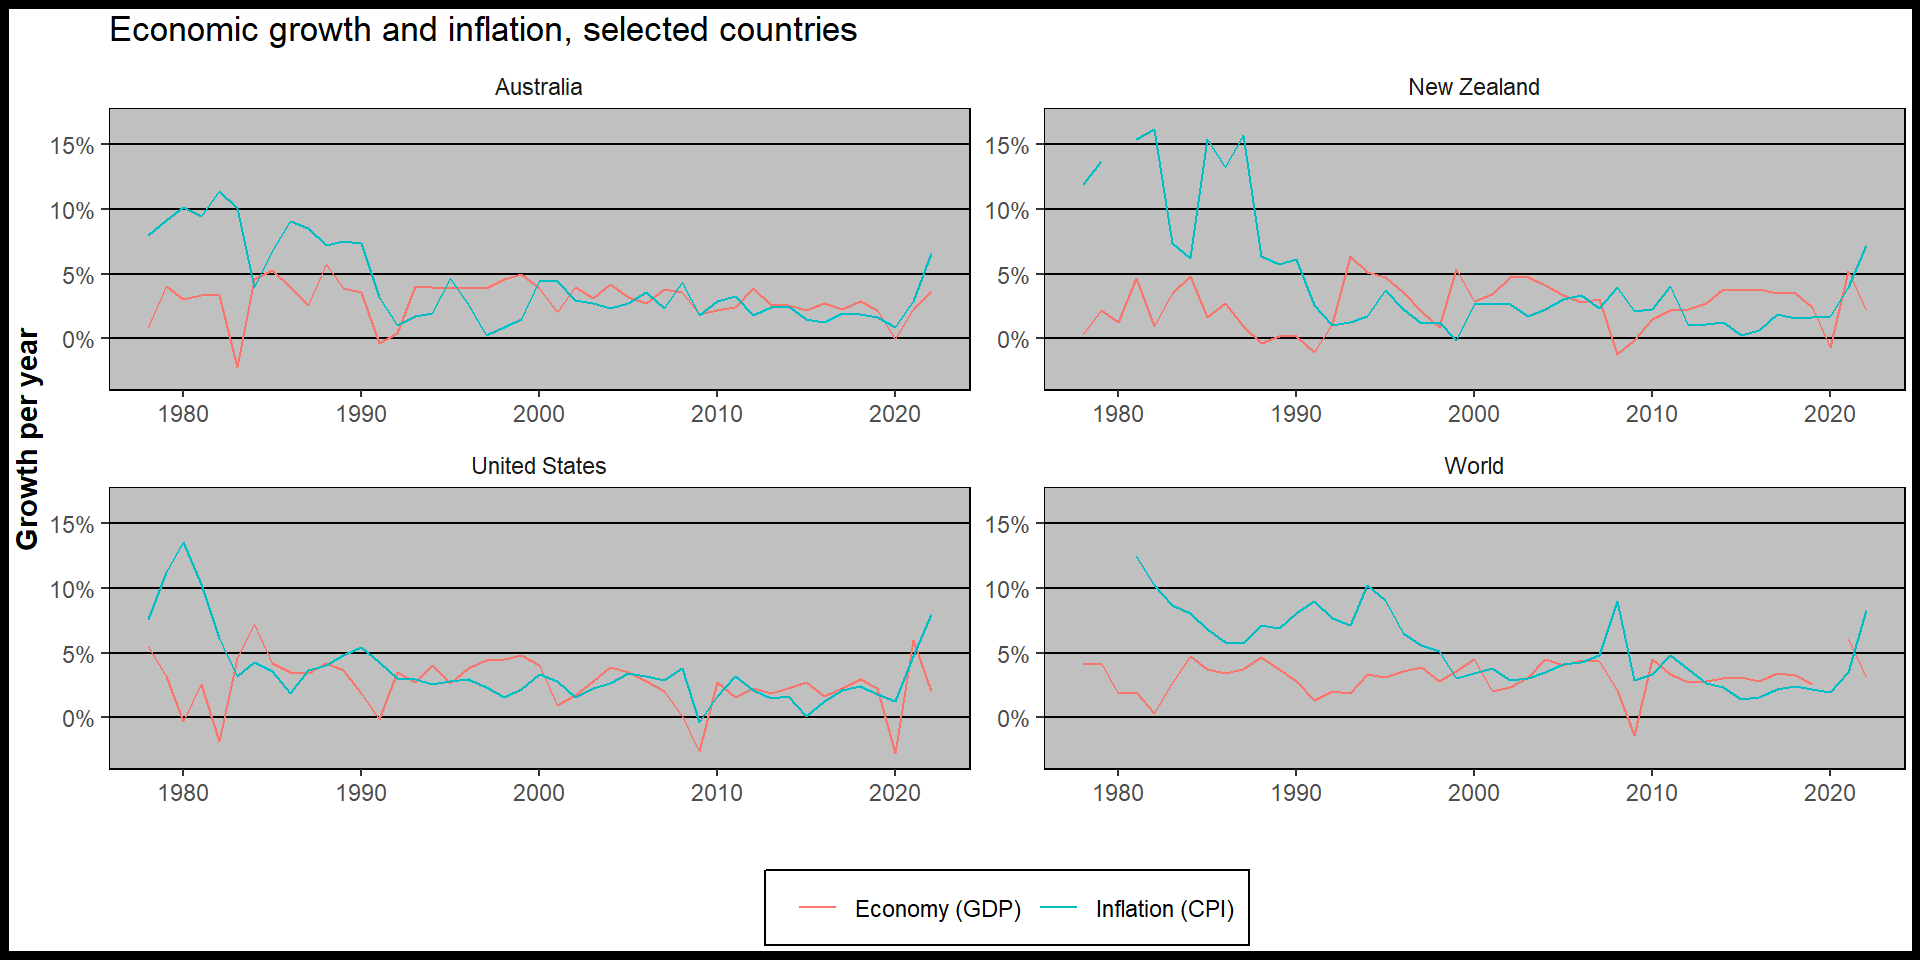
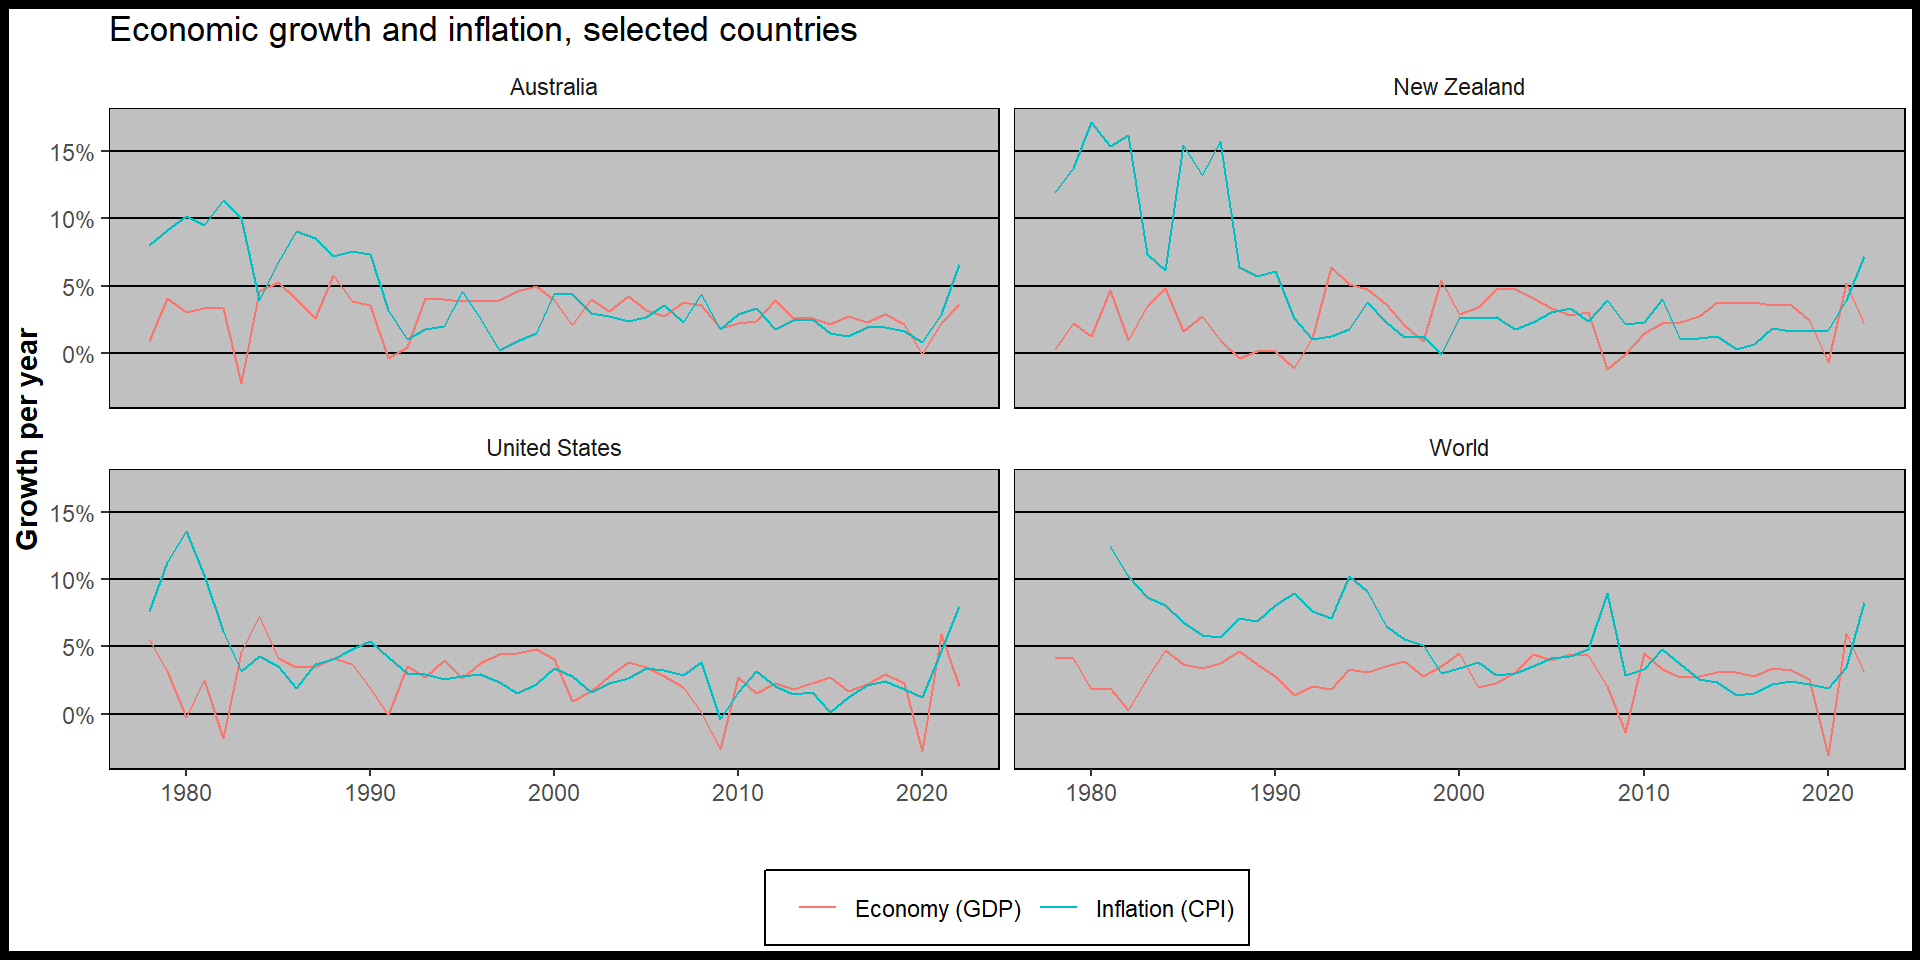
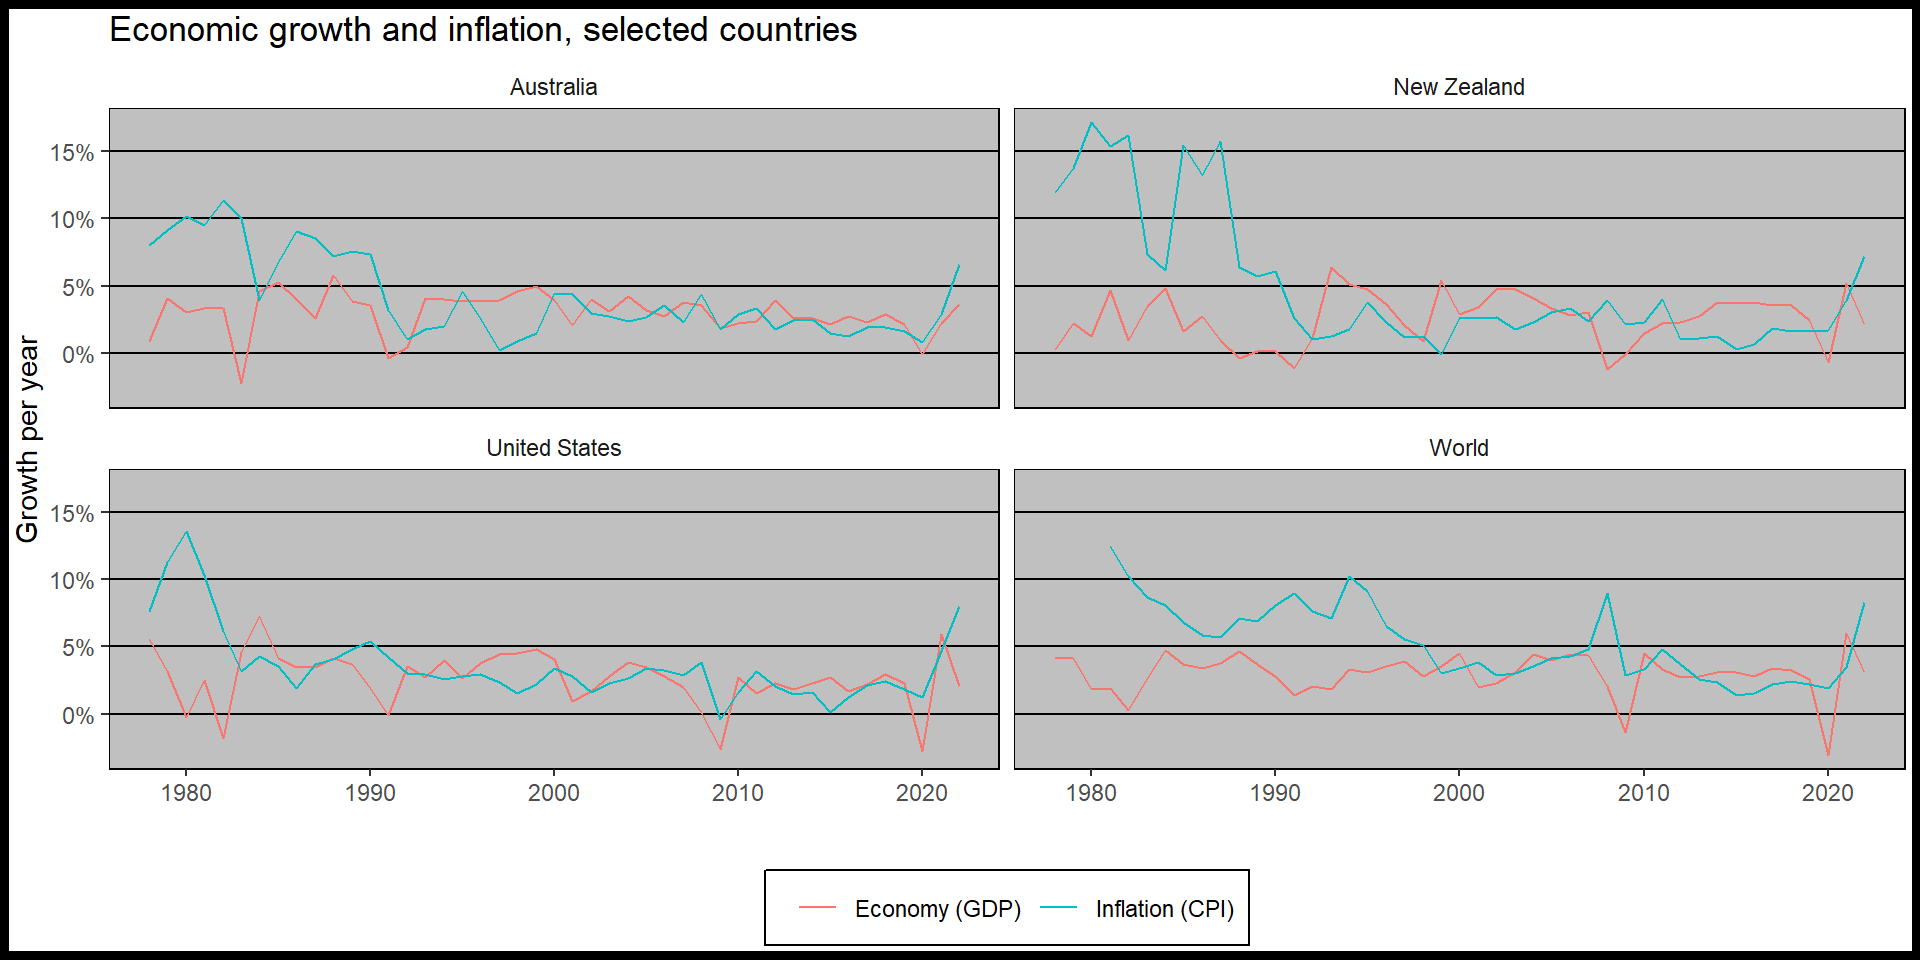
Another dimension
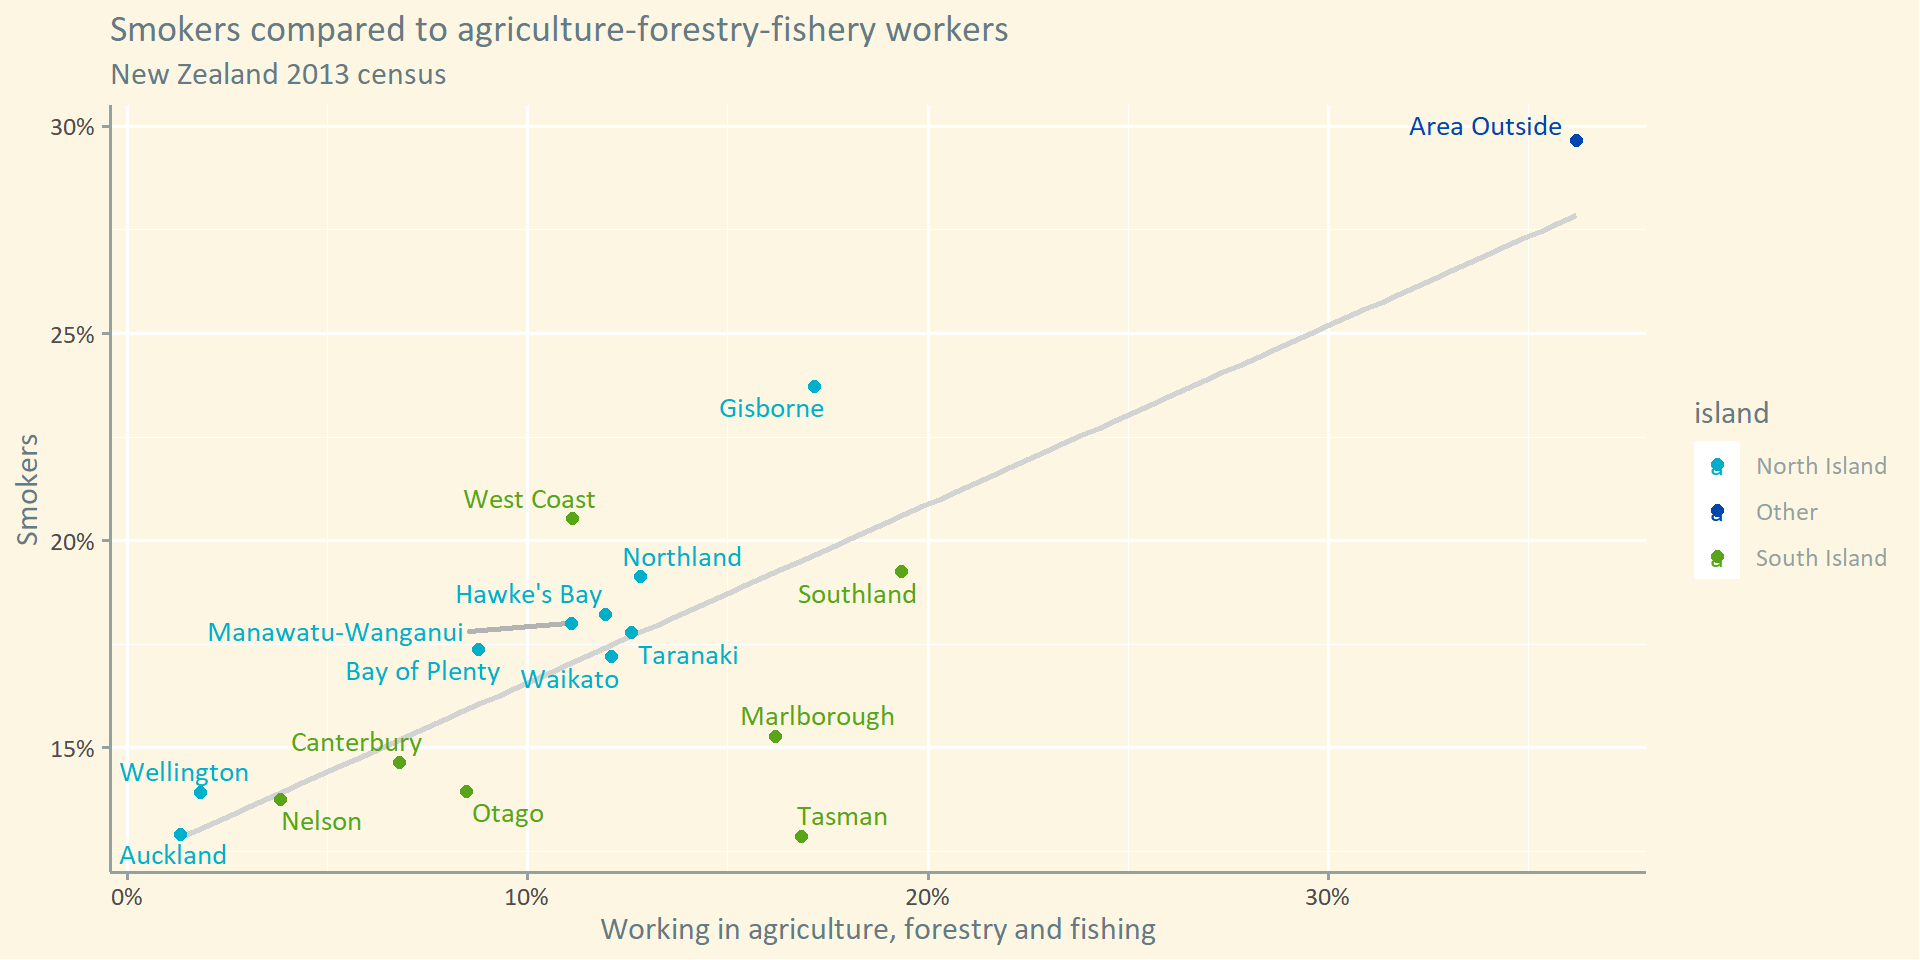
Better than:
Difficult
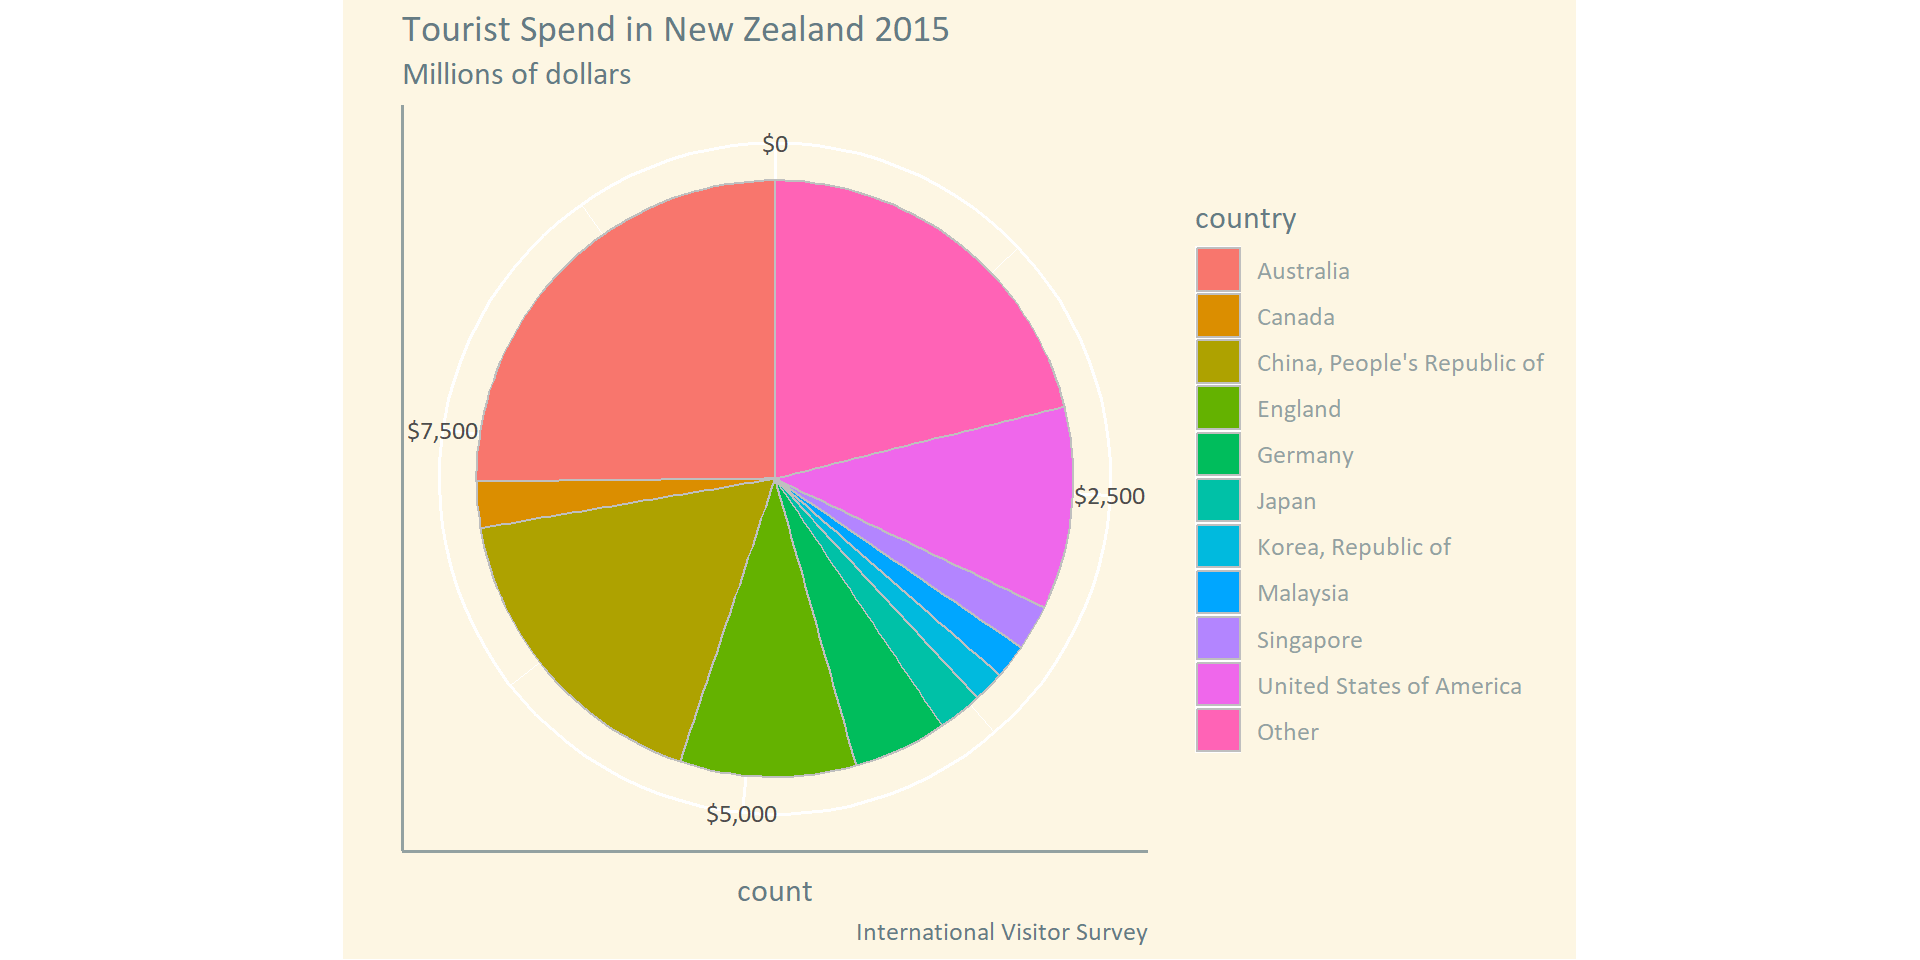
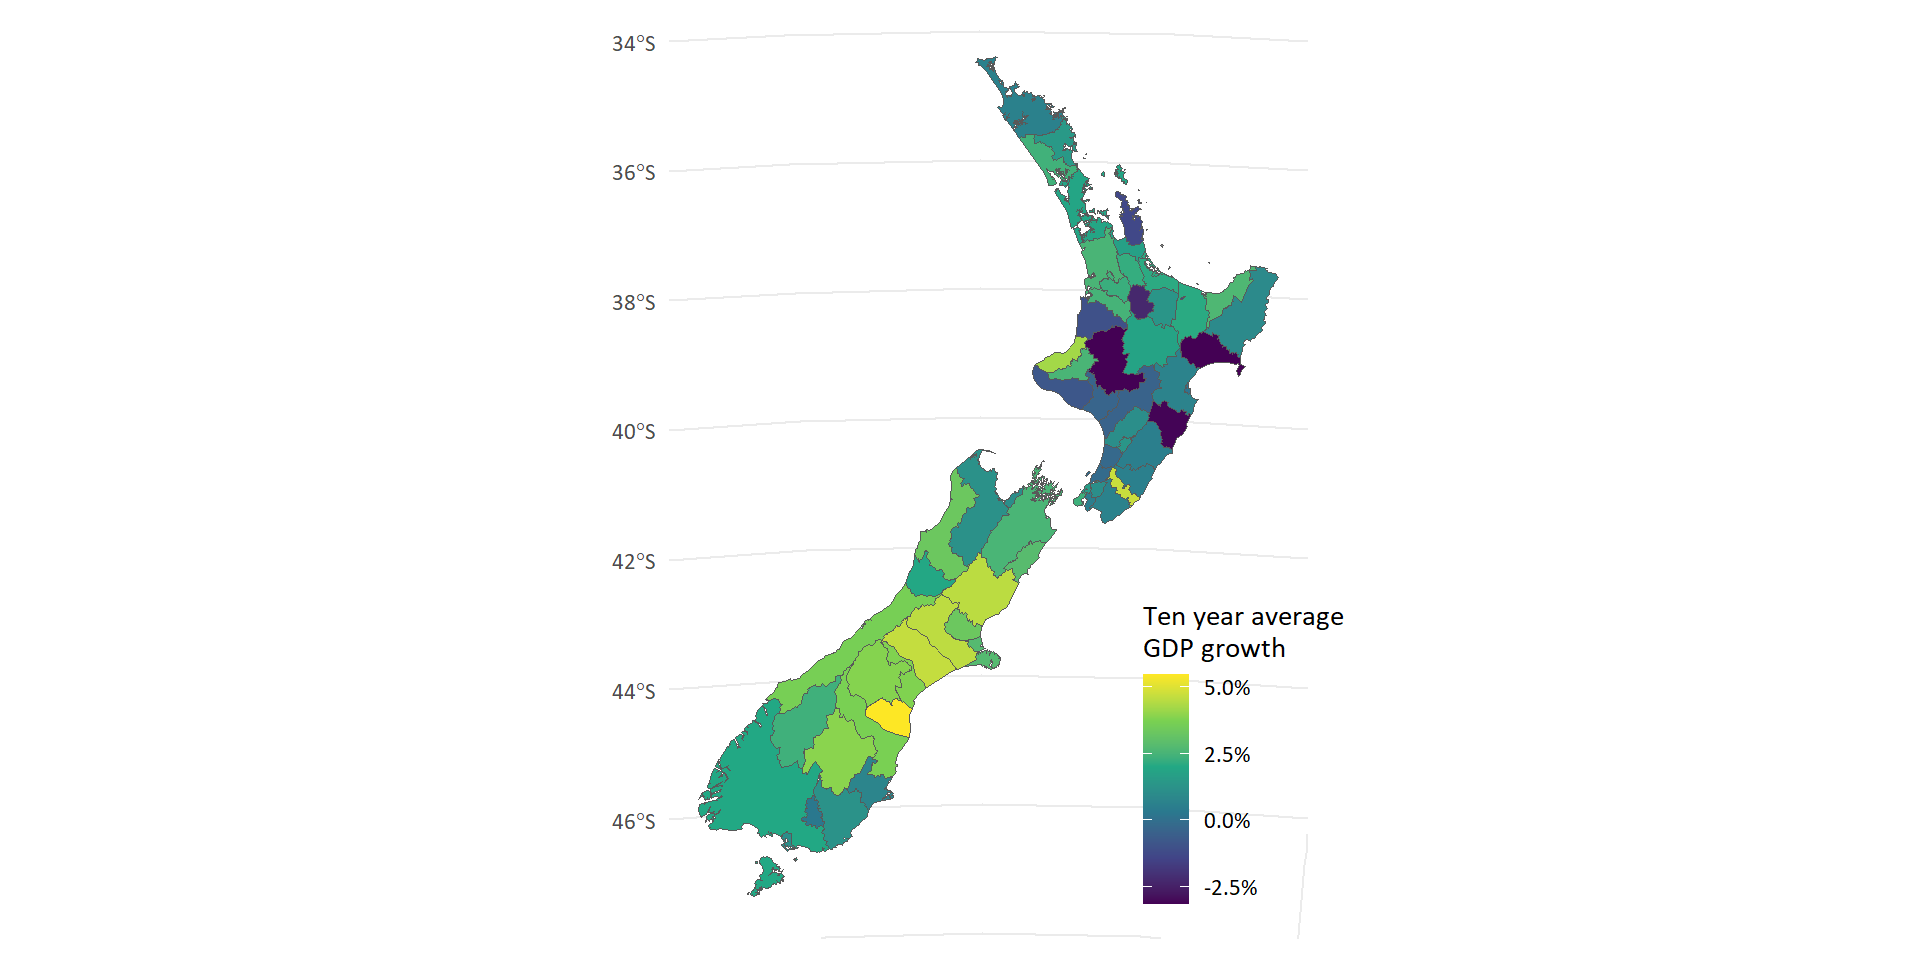
Use cartesian coordinates
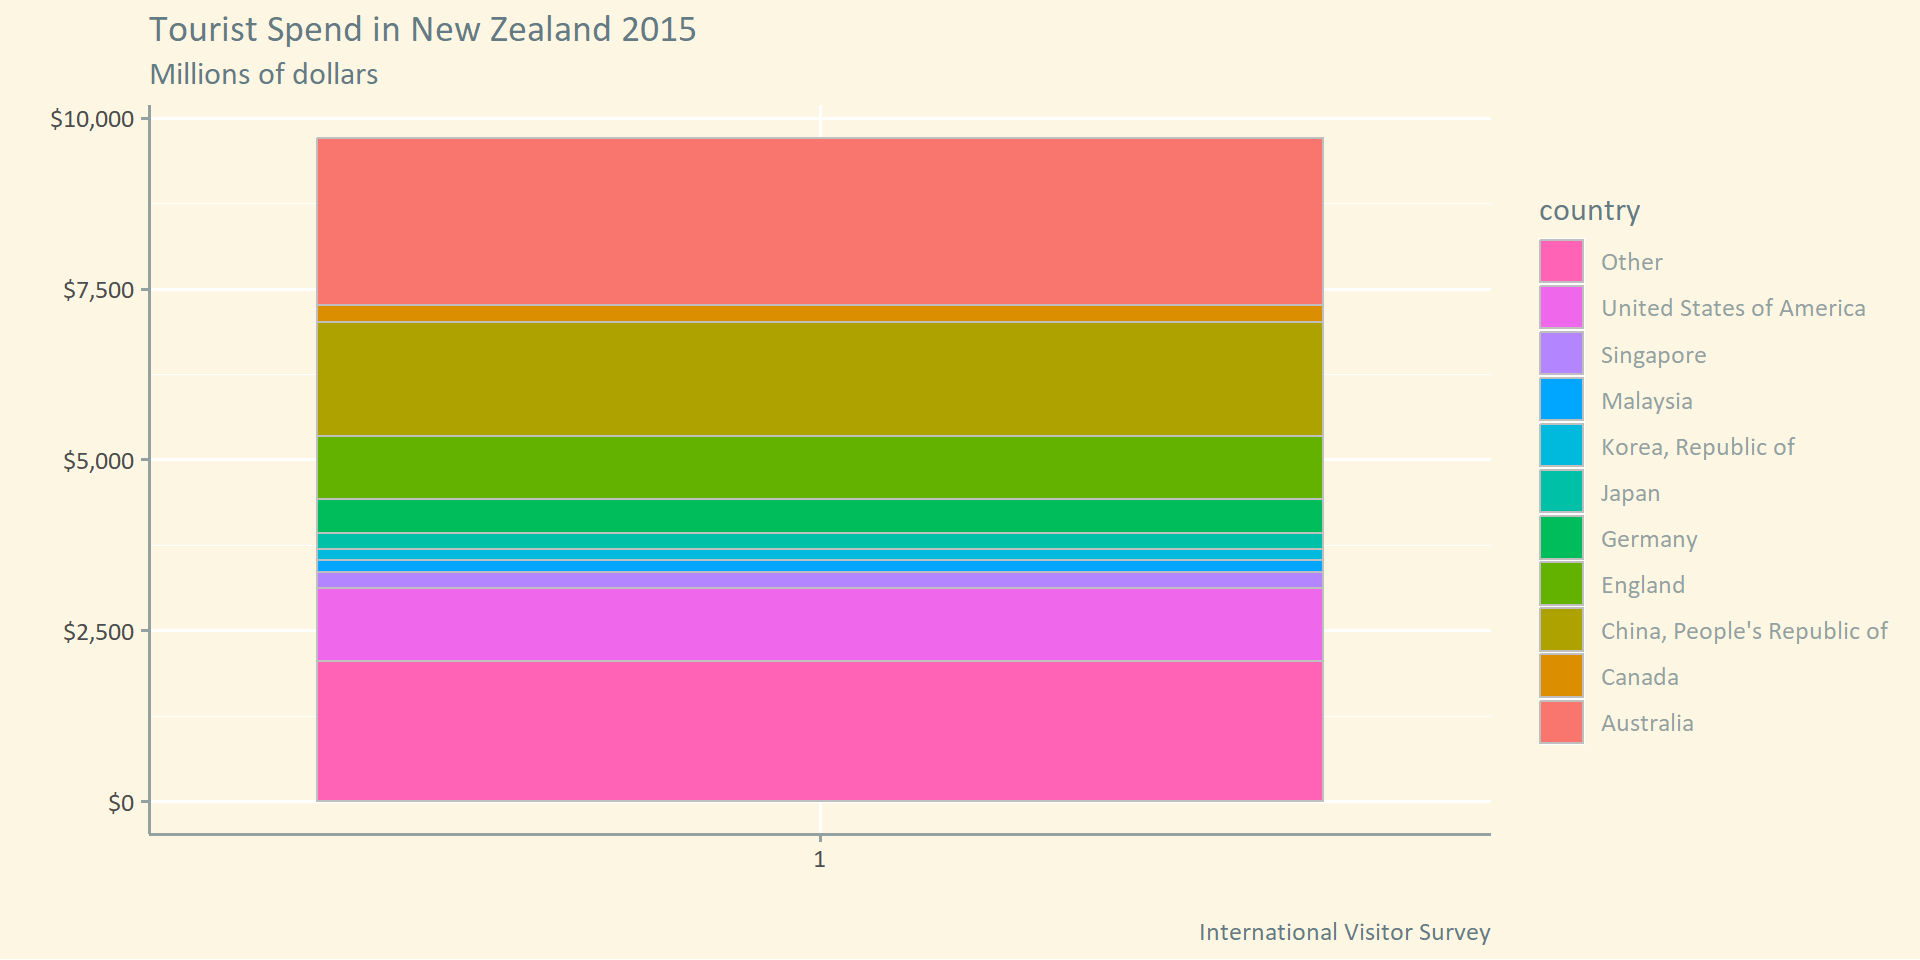
Use height

Flip for readability
Sequence
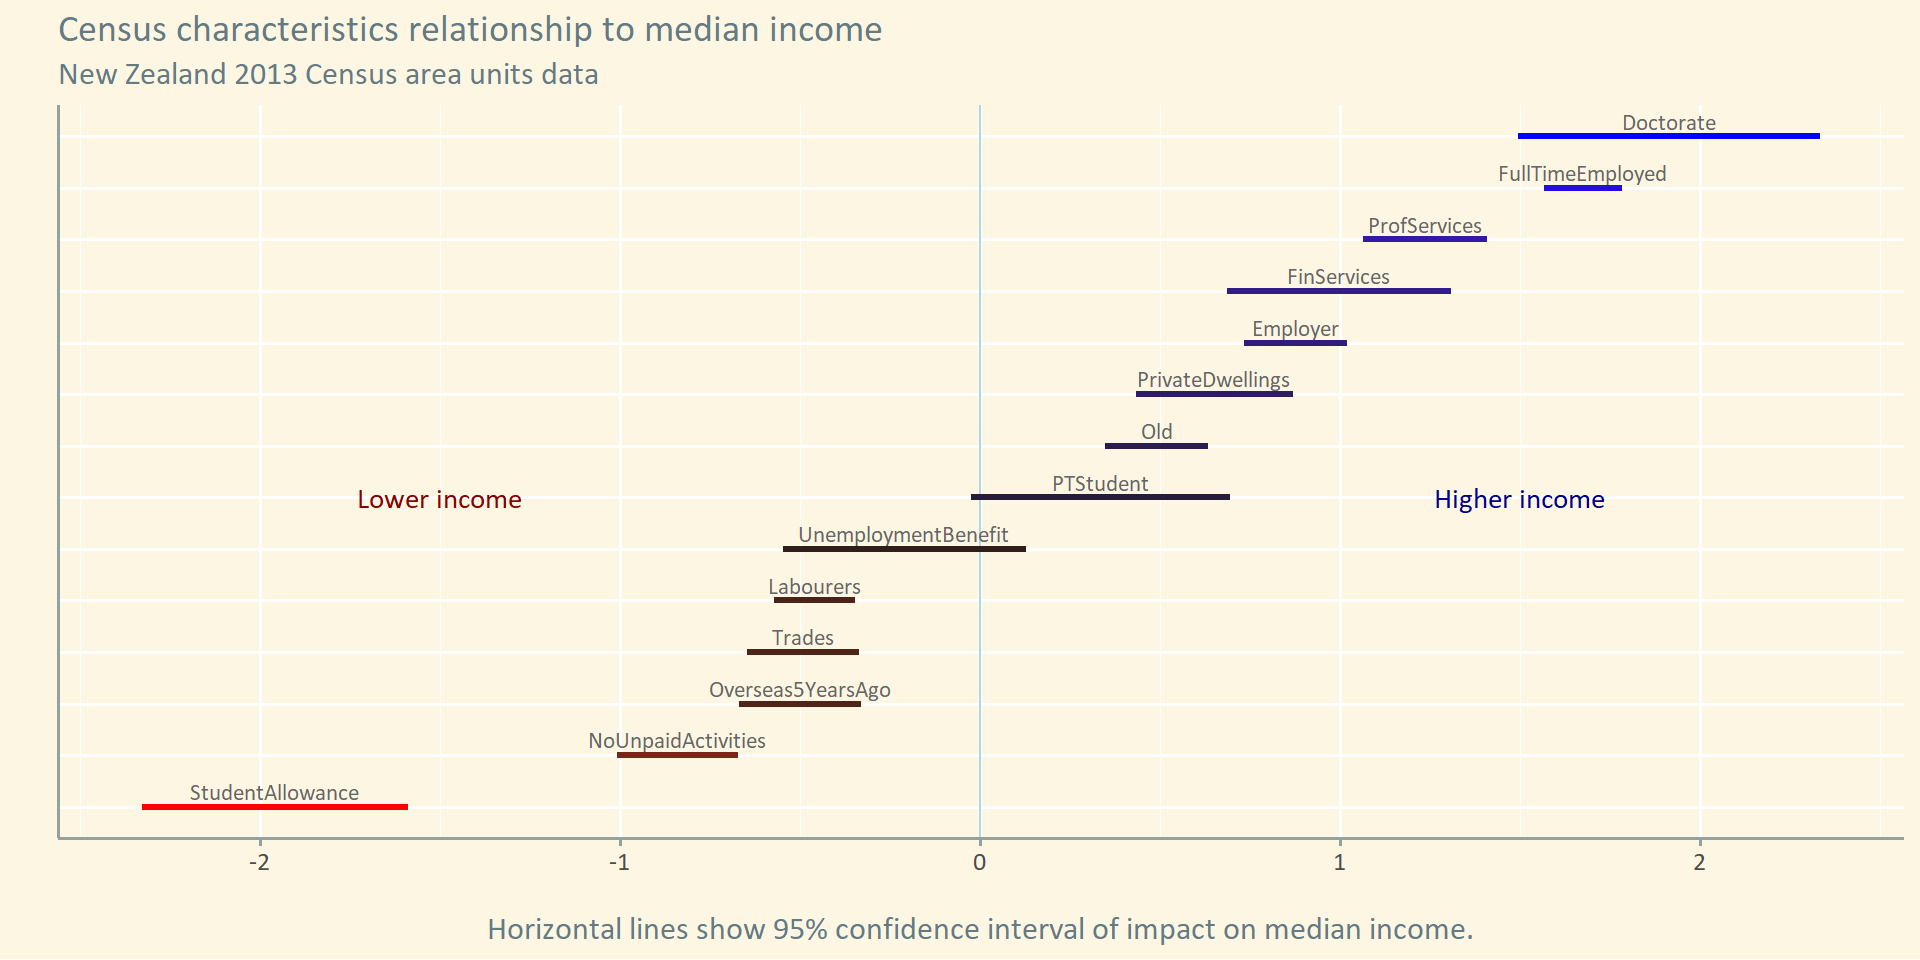
Maximise focus on data

Labels near the data
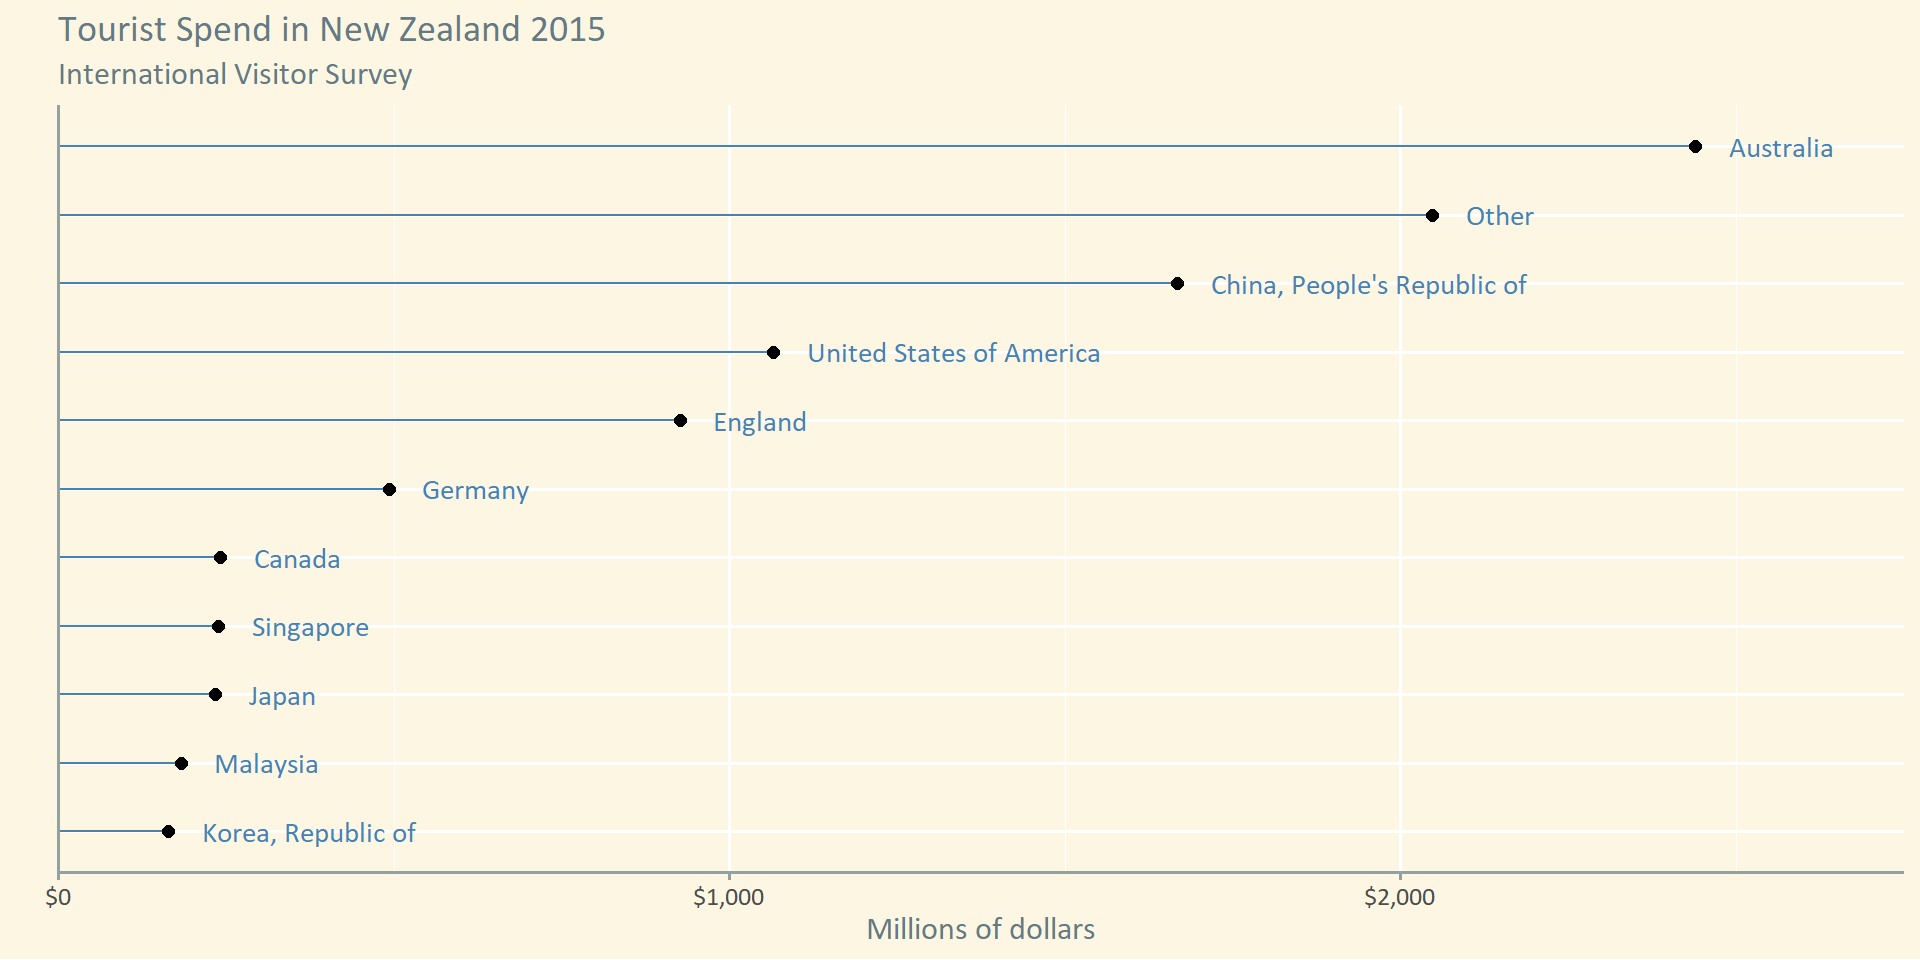
Use like a table
Better than
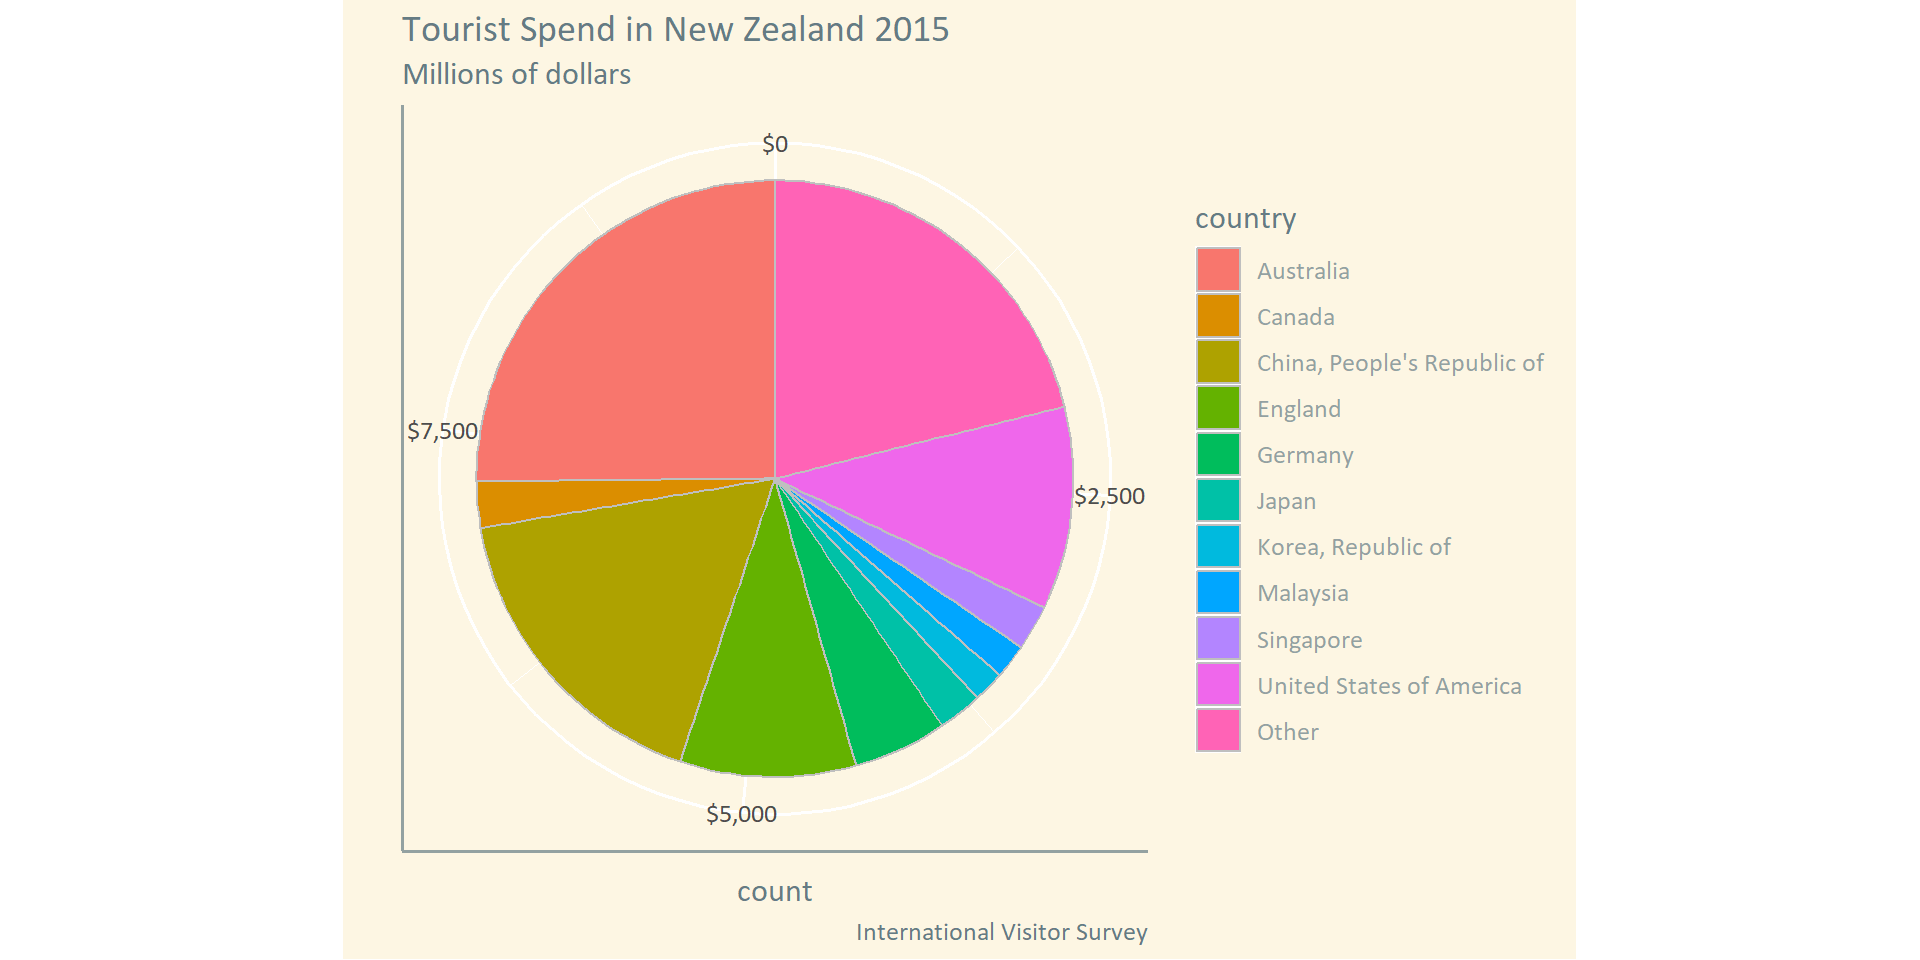
Not just this
But this
Or this
Final word
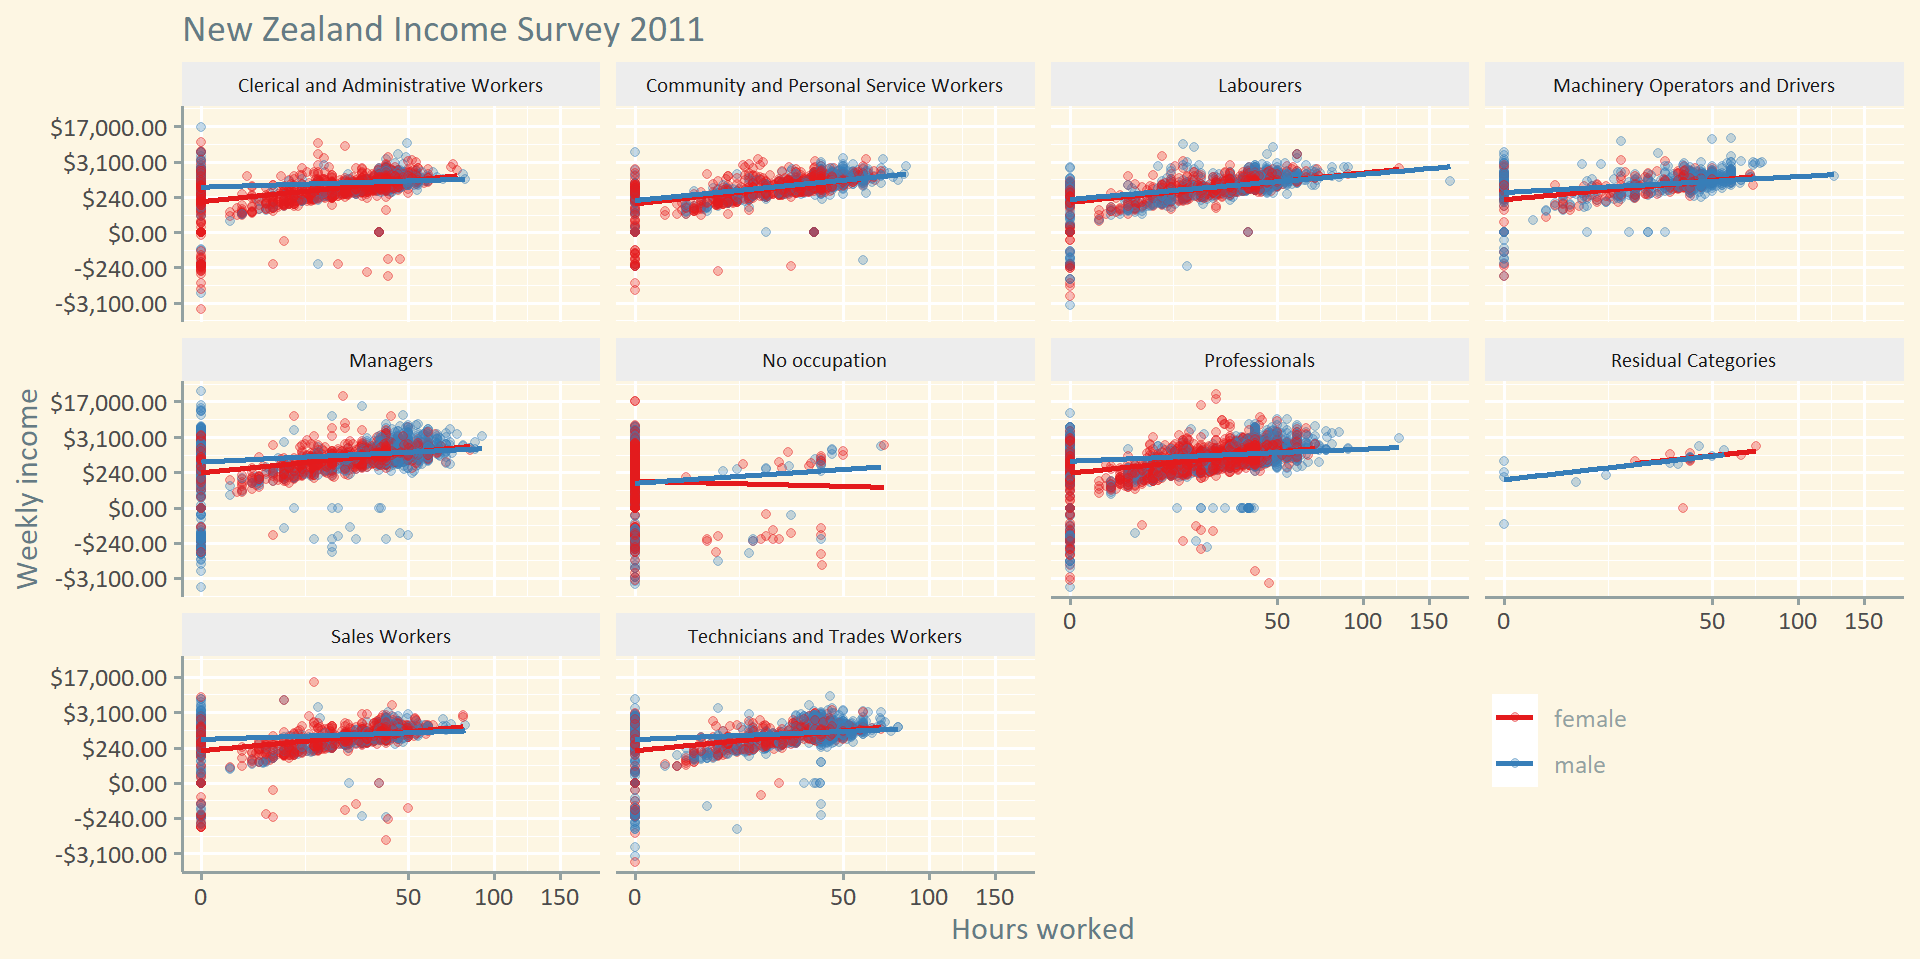
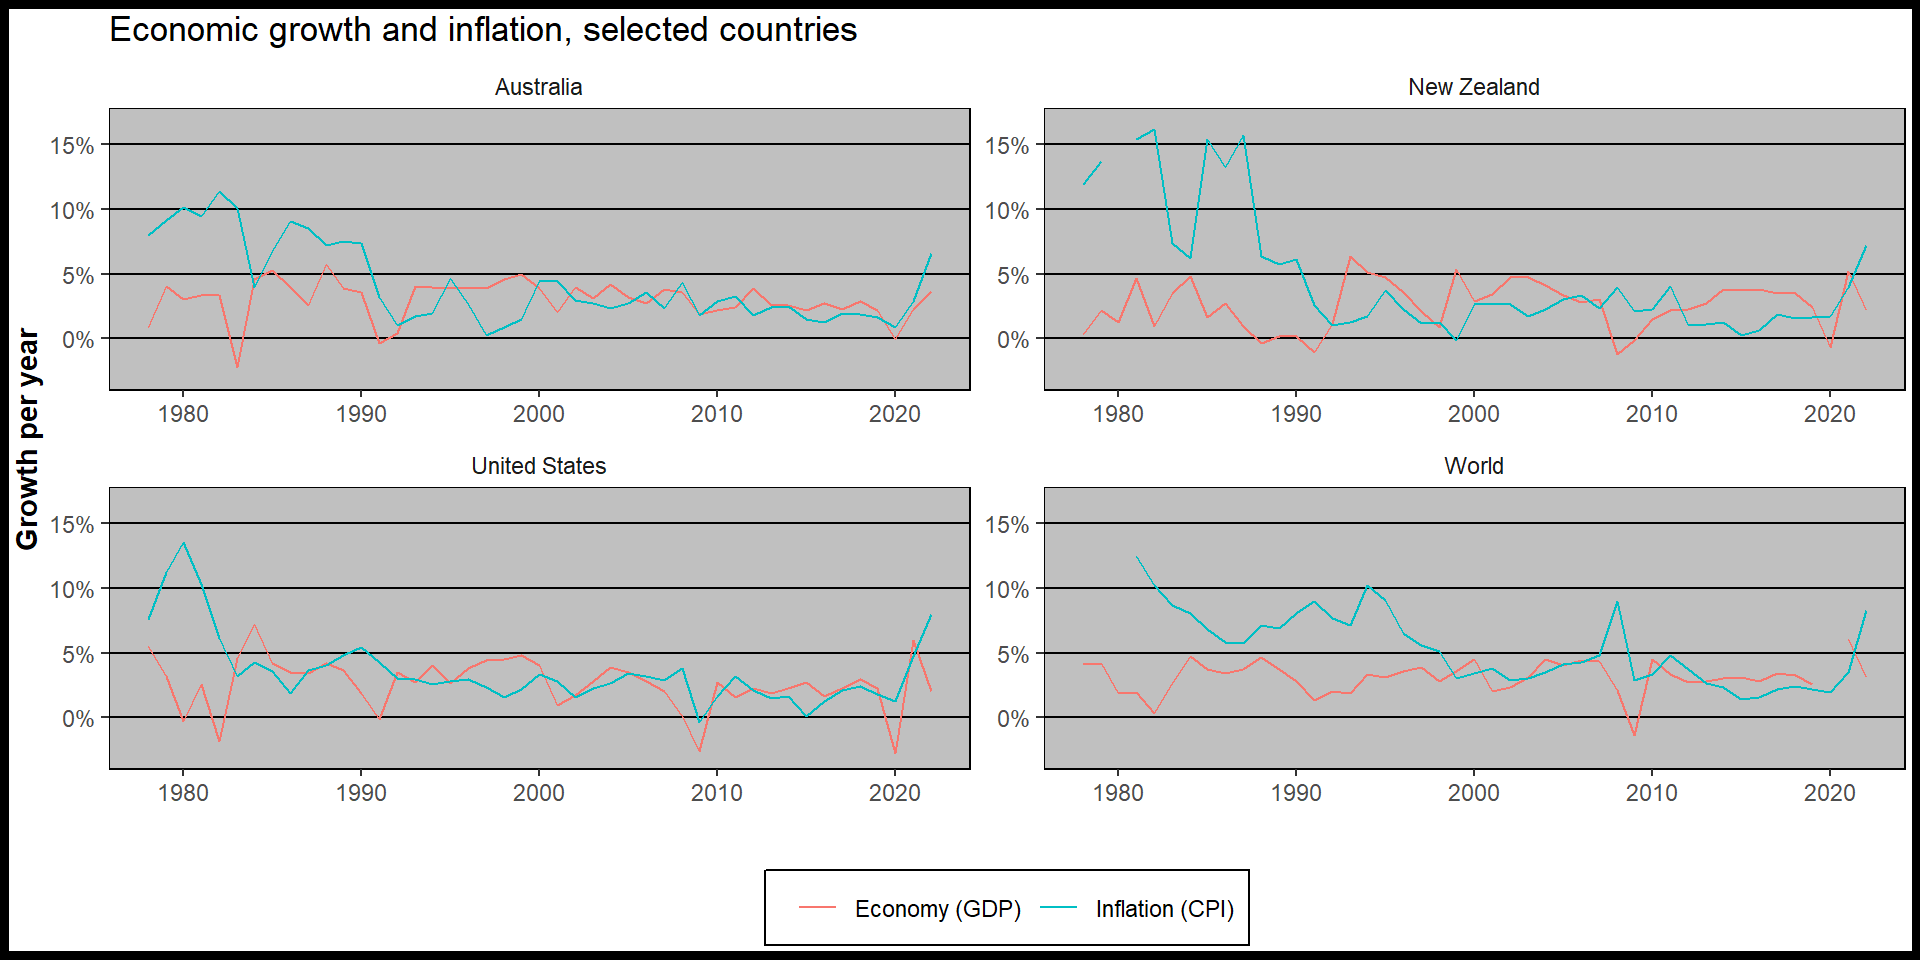
- Comparative
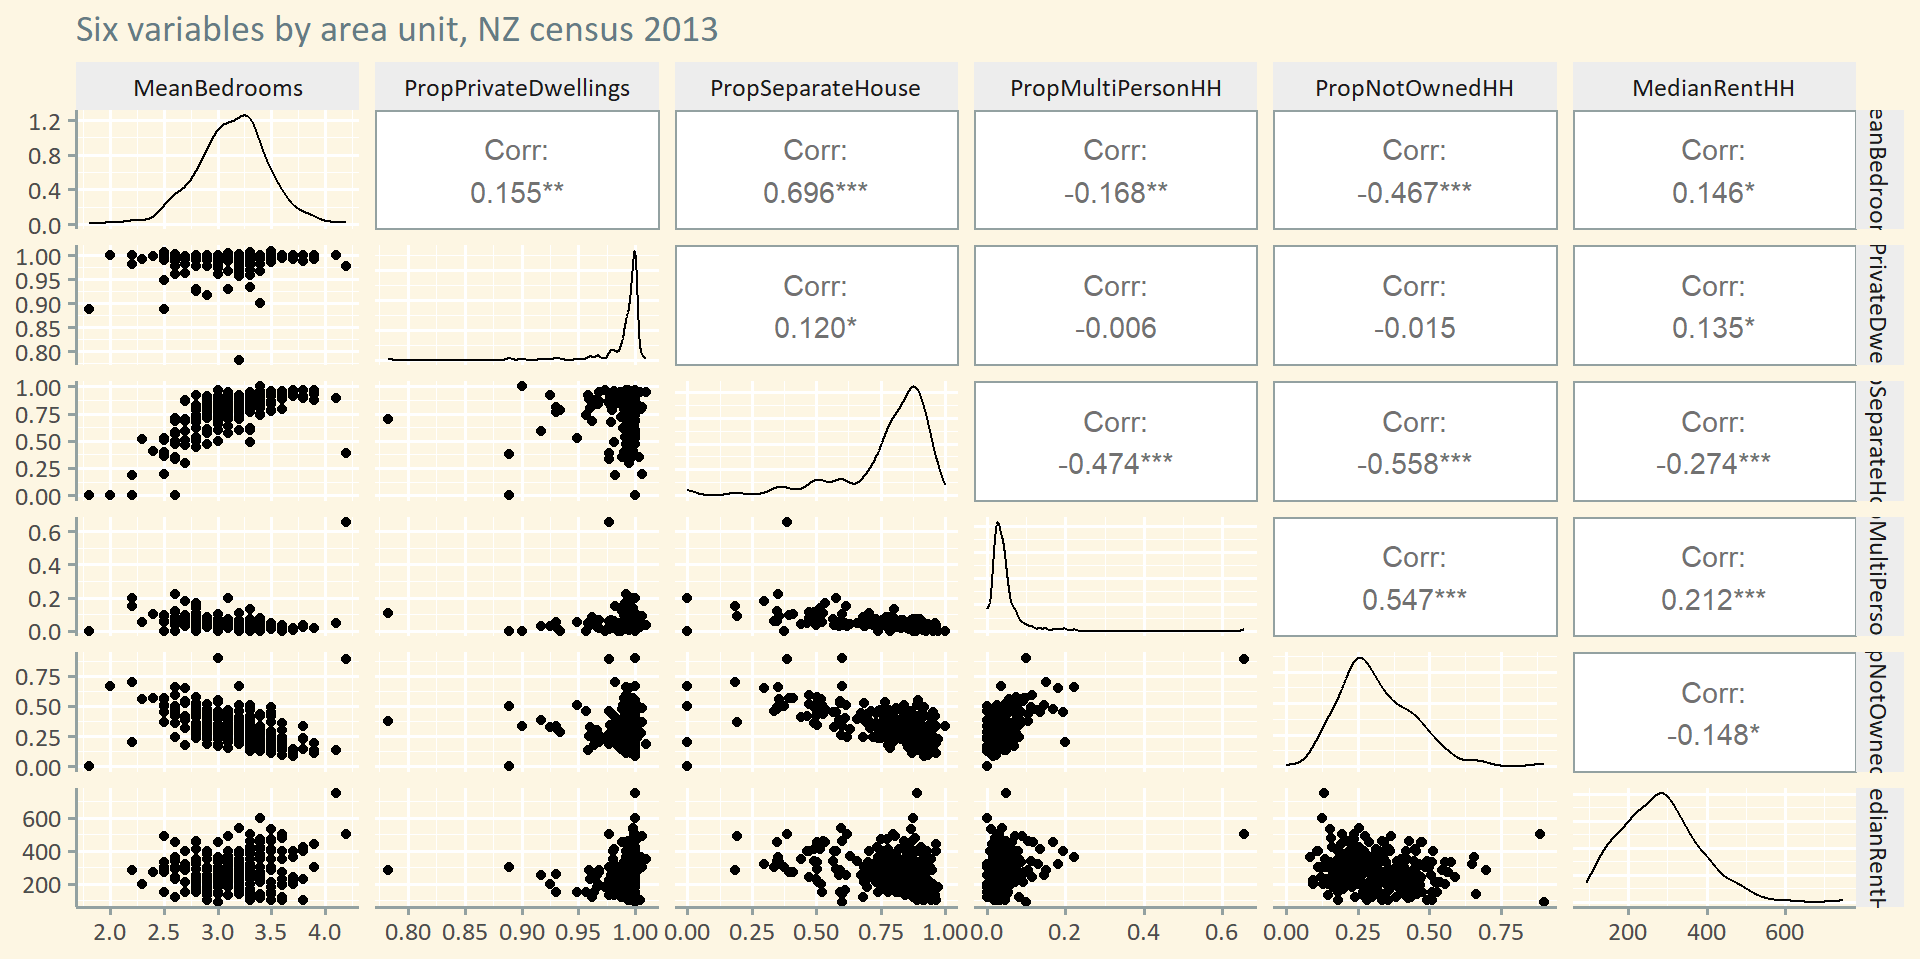
- Multivariate
- Reveal interactions
- Nearly all the ink is data ink
- All attention to the data and to the story!
Source code available at: https://github.com/PacificCommunity/sdd-graphics-talk-2023-July/